How to Get There
Site Menu Navigation
Reports > Labor > Labor SvA
Purpose & Common Uses
This advancedThis article shows users where users can find the Labor Scheduled vs. Actual (SvA) report and which metrics are available.
Overview
The Labor Scheduled vs. Actual (SvA) page allows an in-depth view of labor data by Region, Area, or Store, as well as by Employee or Date.
Increasing labor scheduling efficiency
Dialing into Scheduled vs Actual Sales, Labor $ and Over Time by Store, Date, Region, or Employee.
Analyzing variance between forecasted sales and actual sales
Calculating labor %
Including or excluding manager hours in labor $ and %
report shows the Scheduled labor hours versus Actual labor hours and their variances. This report is an excellent tool for viewing and managing labor costs. The data displayed is based on how many stores you have selected and the category you selected. Users need the correct security and scope to view more than one location. Typically, a multi-store view is assigned to above-store users.
The report has metrics such as
Forecasted sales and actual sales and the variance between the two.
Forecasted labor and actual labor and the variance between the two are shown in hours and labor percentage.
Ability to include or exclude manager hours shown labor dollar ($) and percentage (%).
Calculates labor percentage (%)
Determine labor scheduling efficiency.
Print data based on parameters selected.
Managers can reduce labor by adjusting the schedule to meet the expected daily sales, cutting employees during dayparts when sales are low, increasing sales, or ensuring employees clock out on time.
Users with access to multiple locations and who can view multiple locations can view the following data:
By Date
By Store
By Region
When viewing a single store, the data options you can view are:
By Date
By Shift
By Store
By Employee
Let’s look at all the metrics available based on access level.
Video
Check out this video to view the data available for Single-Store users.
| Widget Connector | ||||||||||
|---|---|---|---|---|---|---|---|---|---|---|
|
Check out this video to view the data available for Multi-Store users.
| Widget Connector | ||||||||||
|---|---|---|---|---|---|---|---|---|---|---|
|
Table of Contents
| Table of Contents | ||||
|---|---|---|---|---|
|
| Info |
|---|
For additional questions or assistance, please submit a support ticket by visiting the Decision Logic Help Service Center. |
| Info |
|---|
Unable to access this page in Decision Logic?
|
How to Use This Page
Select Viewing Options
Select a Region, Area and Store
Select a From and To date from the calendar
Select a View by Date, Region or Employee
 To View by Region do not select an individual store.
To include Manager Hours toggle the Include Manager Hours button
Managers are configured by Job Code in POS Admin > POS Setup > LaborClick Apply
View by Date
Click on a row to slide out the store-by-store SvA details for the selected date

View by Region
View by Employee
Selecting View by Employee will return a list of all employees with scheduled or actual hours for the date range defined.
To narrow the report by Employee Name select the Employee drop-down in the top right.
Search an employee's name by typing into the Employee field.
View by Employee cannot be ran in All Stores or All Company View.
Results are sorted in ascending order by the following metrics:
Date
Store
Shift Start Time
Name
![]() Multiple clock in and clock out times for a single shift will show as 2 lines.
Multiple clock in and clock out times for a single shift will show as 2 lines.
Metric Definitions & Calculations
Metric
Calculation
Other Notes
Role Name
When scheduled shift exists Role name from Labor Scheduling Maintenance will be used.
When no schedule shift exists and only Actual exists, POS Job name from POS Admin will be used.
Swapped
Will display a checkmark for the employee who picked up the shift
Sched Shift
Scheduled shift start and shift end times from Labor Scheduler
Scheduled Shift time punches
Act Shift
Actual POS clock in and clock out timestamps
Actual Shift time punches
Sched Hrs
Shift End - Shift Start difference in Hours from Sched Shift
Scheduled Hours
Act Hrs
Shift End - Shift Start difference in Hours from Act Shift
Actual Hours worked
Hrs Var
Act Hours - Sched Hrs
Variance of Actual vs. Scheduled hours
Sched OT
Scheduled Hours over 40 hours per Labor Week, Job Role, and Store
Based on Sched Shift from Labor Scheduler
Scheduled Overtime hours
Act OT
Actual Hours over 40 hours per Labor Week, Job Role, and Store
Actual Overtime hours worked
OT Var
Act OT - Sched OT
Variance of Actual vs. Scheduled overtime
Related Articles
Multi-Store Users: View Report
This section will walk through the different view options for users with access to multiple stores. The navigational steps to access the Labor SvA page are the same for all view options. Being by navigating to:
Reports > Labor > Labor SvA
Select the Company, Region, Area, or All Stores.
Selecting multiple stores will populate the appropriate data view options.
Select a Date or Date Range.
Un-toggle Enforce Weeks to select an individual date.
The green dot under a date represents the beginning of a store’s labor calendar. When multiple stores are selected, users may see multiple labor calendars.
Period Start is the beginning of that store’s period. Clients with multiple calendars may not see the Period Start icon on the date selector.
Select the View option.
View by Date: displays forecasted and actual sales and labor by the date or date range selected.
View by Store: provides projected labor thresholds in hours per store and an overview for each store assigned to your profile.
View by Region: displays data at the region level and allows a deep dive into each region listed.
Toggle Include All Jobs if you'd like to include all jobs.
By default, only jobs marked “include” in POS Admin will be shown.
You can skip this step if you do not want to include all job hours in the report.
Click Apply.

View By Date
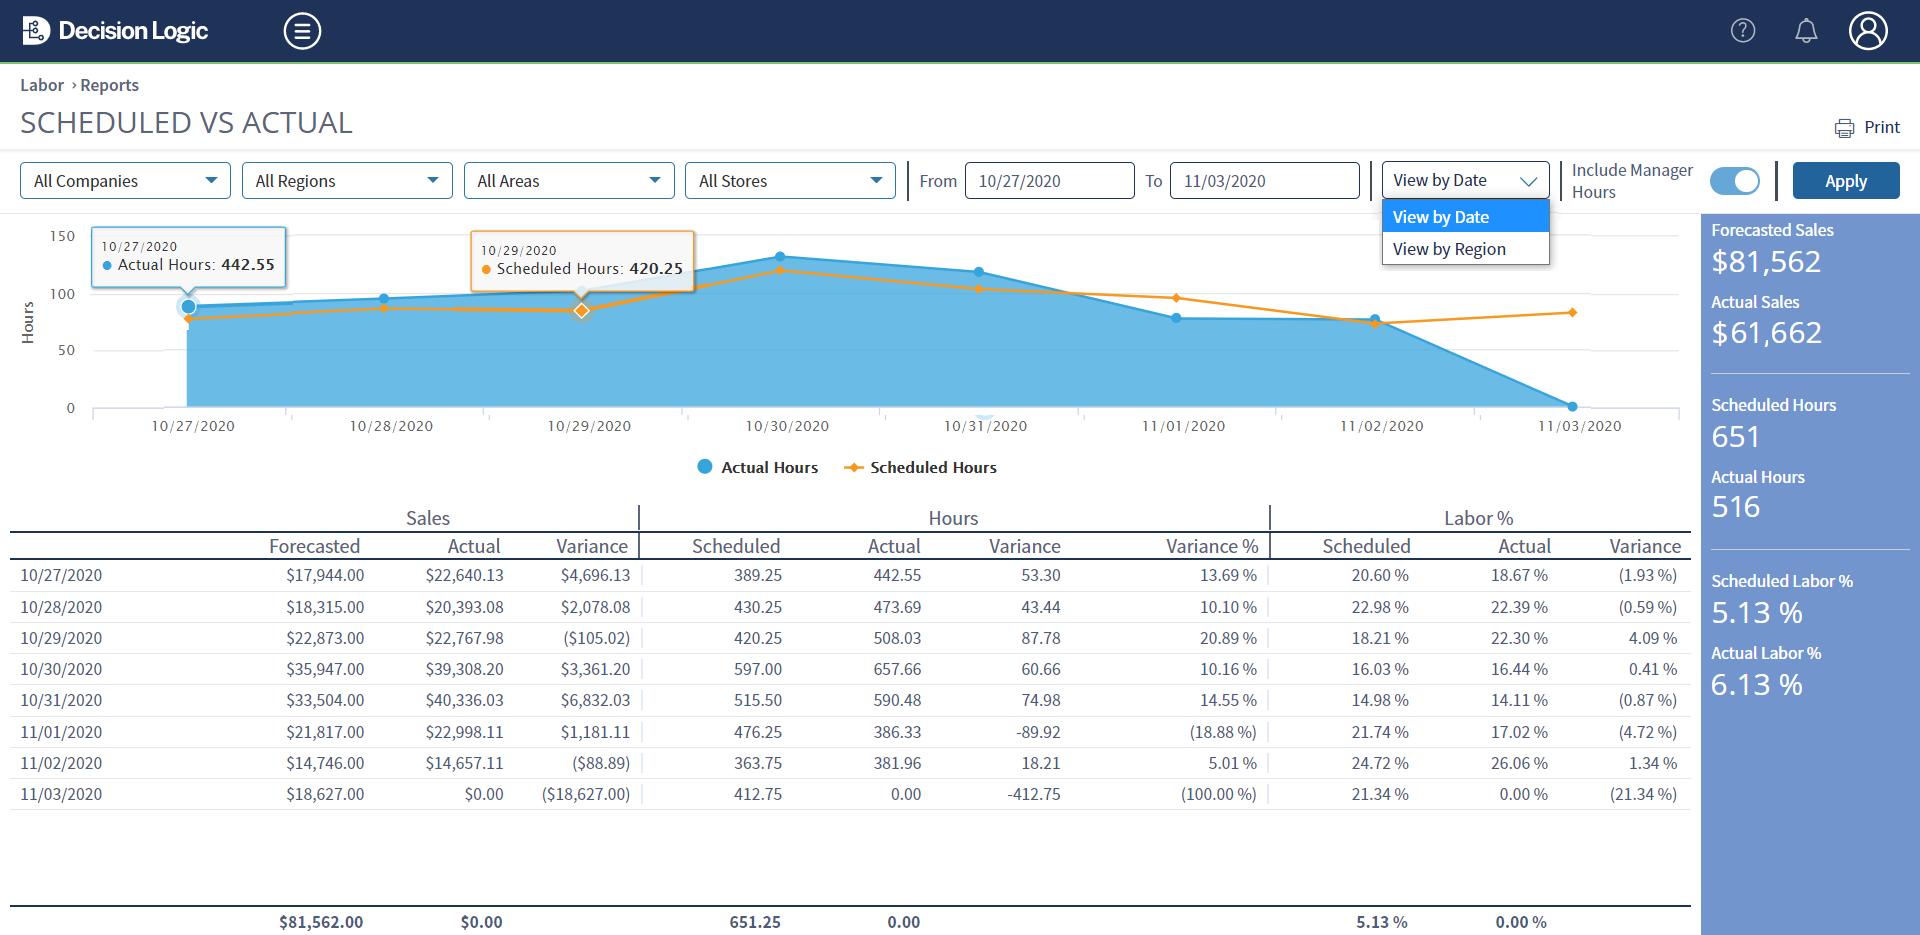
The View by Date option displays forecasted and actual sales and labor by the date or date range selected. Follow the steps above to access the View By Date results for multi-store users.
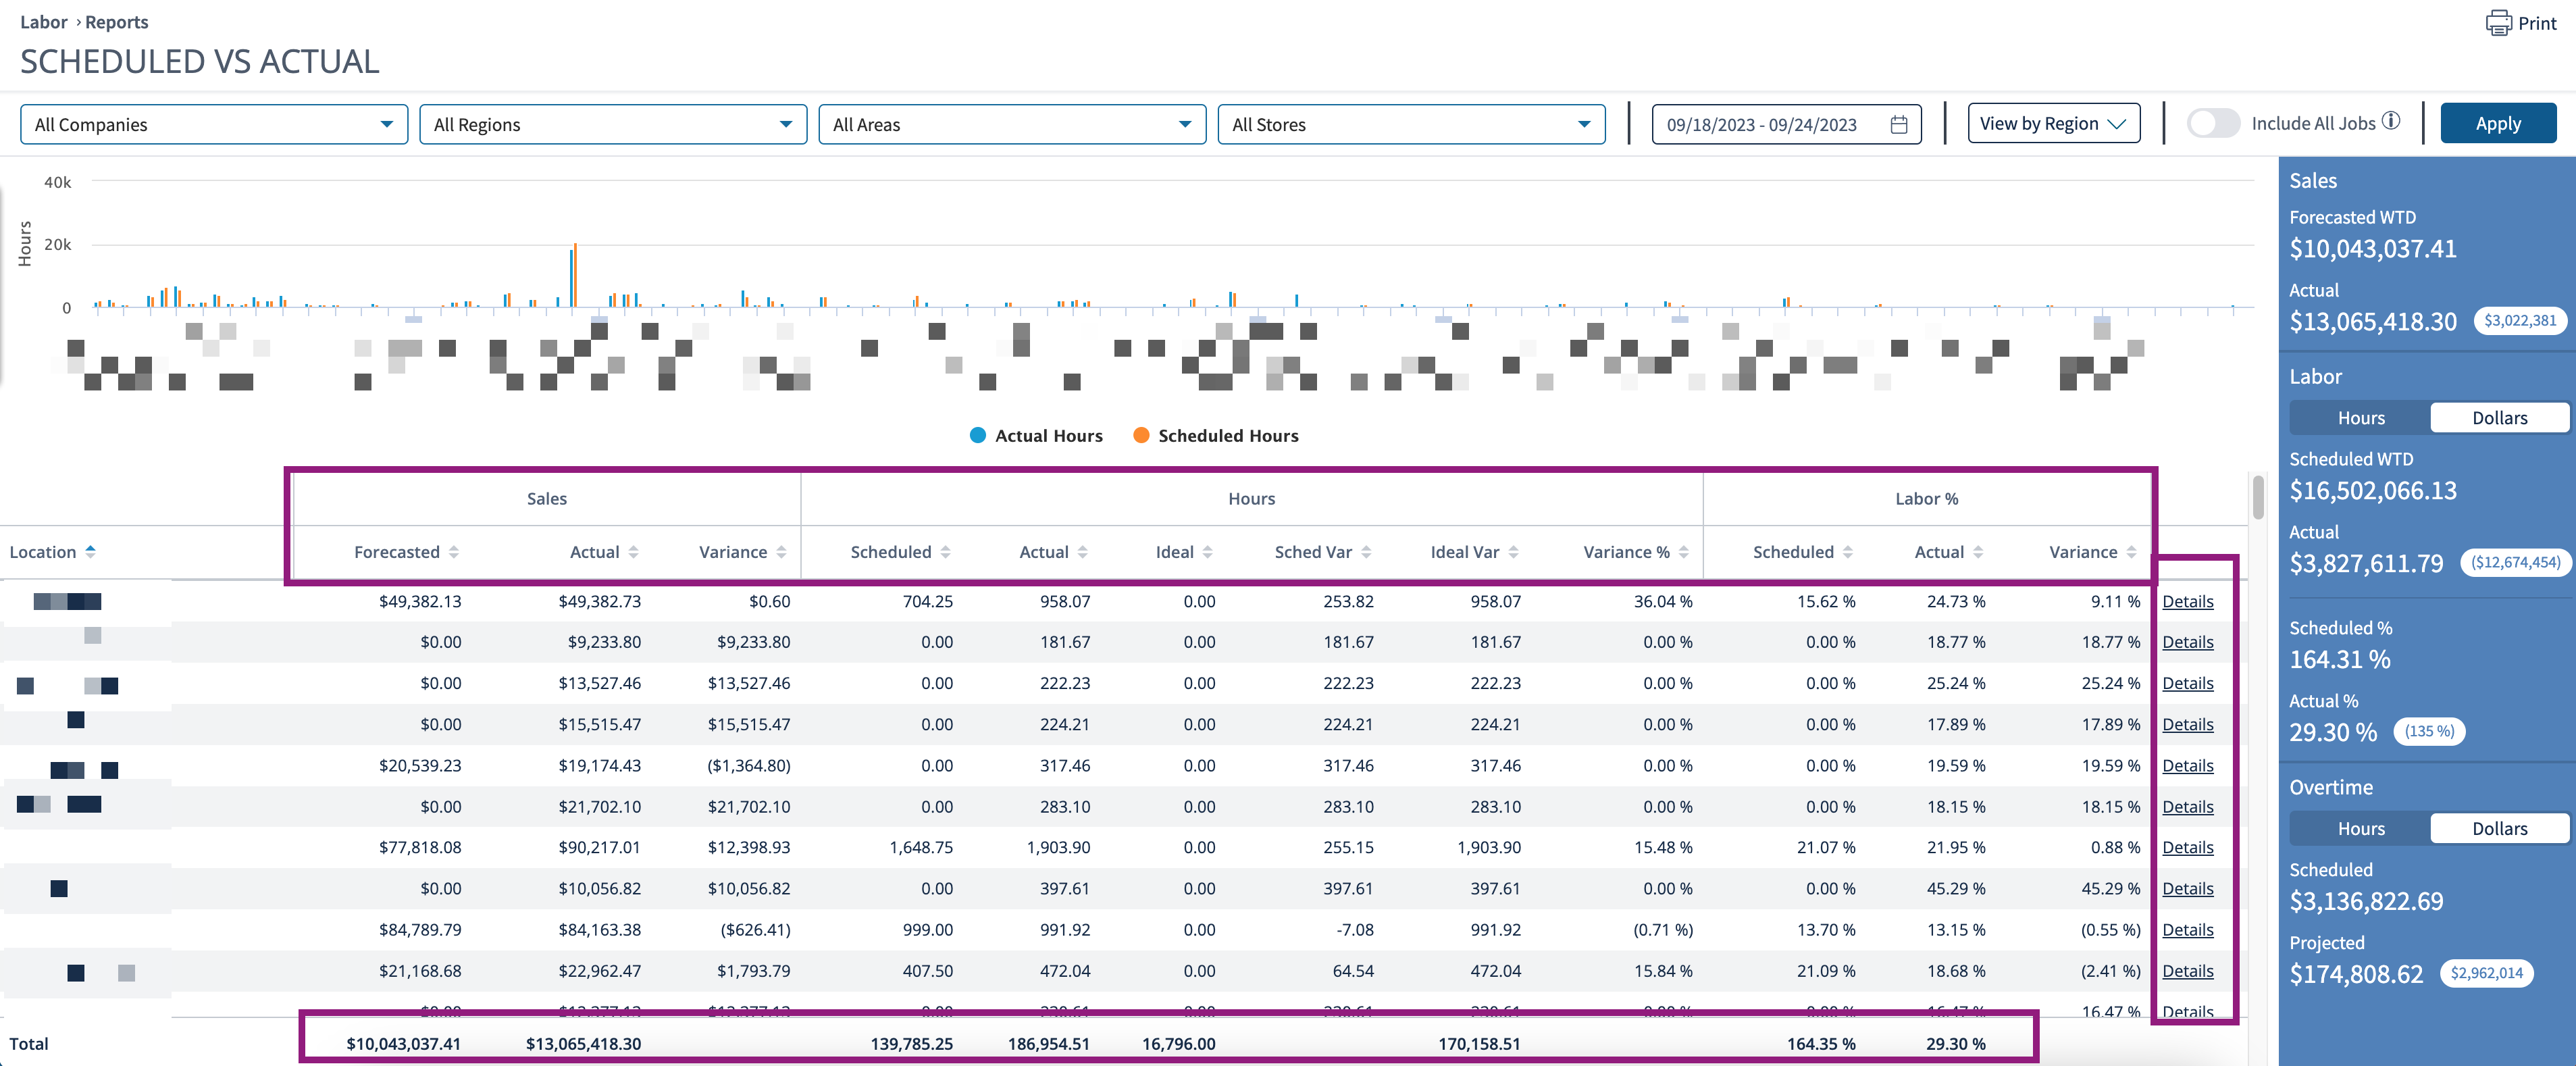
Example report.

Results reveal a trend line for the Actual vs. Scheduled Hours, date(s), sales, hours, labor percentage (%), and totals for the three categories on the bottom. In addition, users can interact with the graph by selecting or unselecting Actual Hours or Scheduled Hours
The side panel shows:
A quick overview of the Total forecasted and actual Sales by dollar amount.
The Labor data in Hours and Dollars and the variance between the two. The default view is Dollars. Click Hours to toggle to the Hours view.
The Labor data for Scheduled and Actual labor percentages and the variance between the two.
The scheduled and projected Overtime in Hours and Dollars. The default view is Dollars. Click Hours to toggle to the Hours view.

The Sales category shows:
Forecasted sales in dollars.
Actual sales in dollars.
The variance between Forecasted and Actual sales in dollars ($).
Total forecasted and actual sales.
| Info |
|---|
Variance is Actual Sales - Forecasted Sales |
The Hours category shows:
Scheduled labor hours were created using Decision Logic's Labor Scheduler feature. Some businesses may include manager hours when selecting the parameters to show data.
Actual labor hours of how many employees clocked in/out and may include manager hours if selected.
Ideal labor hours based on what is defined in Labor Templates.
Scheduled Variance of labor hours as a number.
Variance is displayed as a percentage (%) of the Scheduled Variance.
| Info |
|---|
Schedule Variance is Actual Hours - Scheduled Hours |
The Labor % category shows:
Scheduled and Actual hours as a percentage of Forecasted and Actual Sales, respectively.
The variance between the Schedule Labor % and Actual Labor %.
| Info |
|---|
Variance is Actual % - Scheduled % |
Users can filter the column by clicking the arrow that appears.

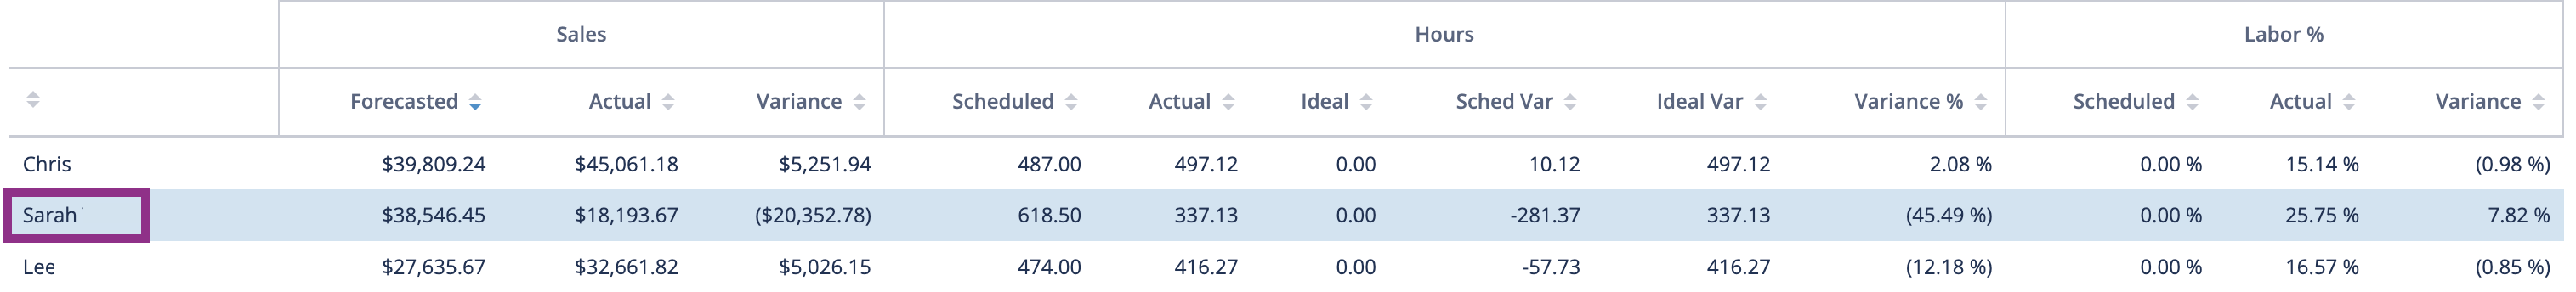
Users can click on the Details link to see a fly-out to dive deeper into the data hierarchy, starting with the regions listed.

Clicking on a Region will reveal area(s) associated with that region and provides an overview of sales, hours, and labor percentage. Clicking on an Area displays the stores assigned to the manager associated with the area. It provides an overview of sales, hours, and labor percentages for each store within the area. Lastly, clicking on a store provides that store's metrics.


View By Store
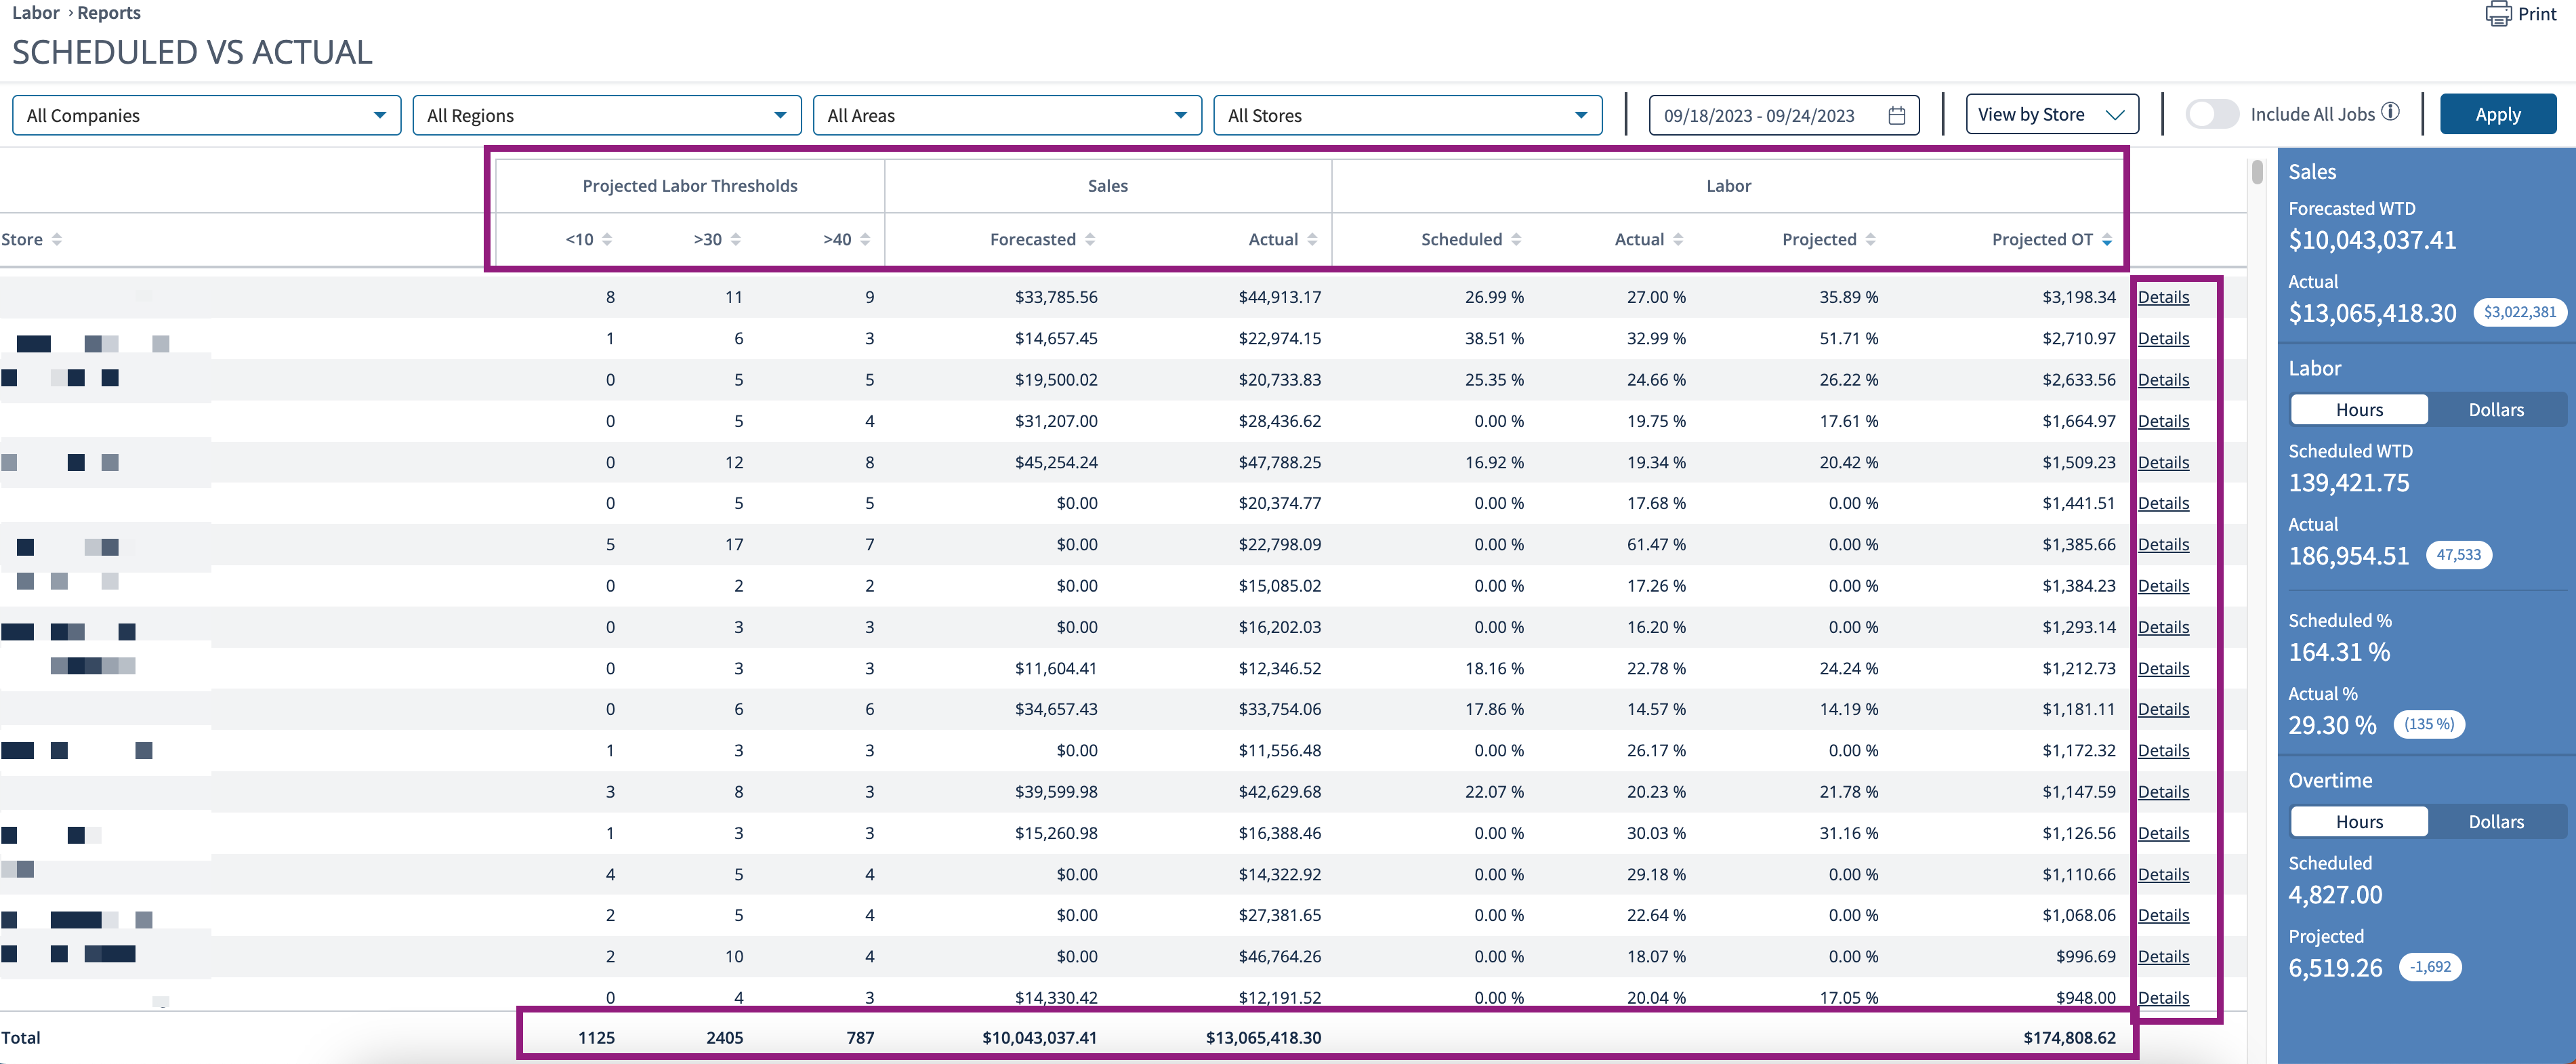
This view allows multi-store users to see how their stores are performing. The default view of stores is listed by projected overtime (OT) in dollars. Users can sort the list based on any available column by hovering their mouse over it and using the arrows to sort.
Projected Labor Thresholds show how many employees are scheduled for less than ten hours, greater than thirty hours, and greater than forty hours. This information can help with employee retention by identifying over and under-utilized employees.
The Sales section shows forecasted and actual sales for each store.
The Labor section shows the percentages of scheduled, actual, and projected labor and projected overtime in dollars.
The Details links let you dive deeper into a store’s labor data by providing a slide-out where you can click on each page for more information. Additionally, you can filter the data by projected labor thresholds.
The Side Panel show sales, labor in hours and dollars, and overtime in hours and dollars. The default view is in ‘Hours.’
The bottom row shows the totals for their respective columns.
Example Report.
Example Details data.

| Info |
|---|
Projected Hours = Actual time worked + Scheduled time not yet worked. |
Users can filter Projected Hours categories by selecting the drop-down.

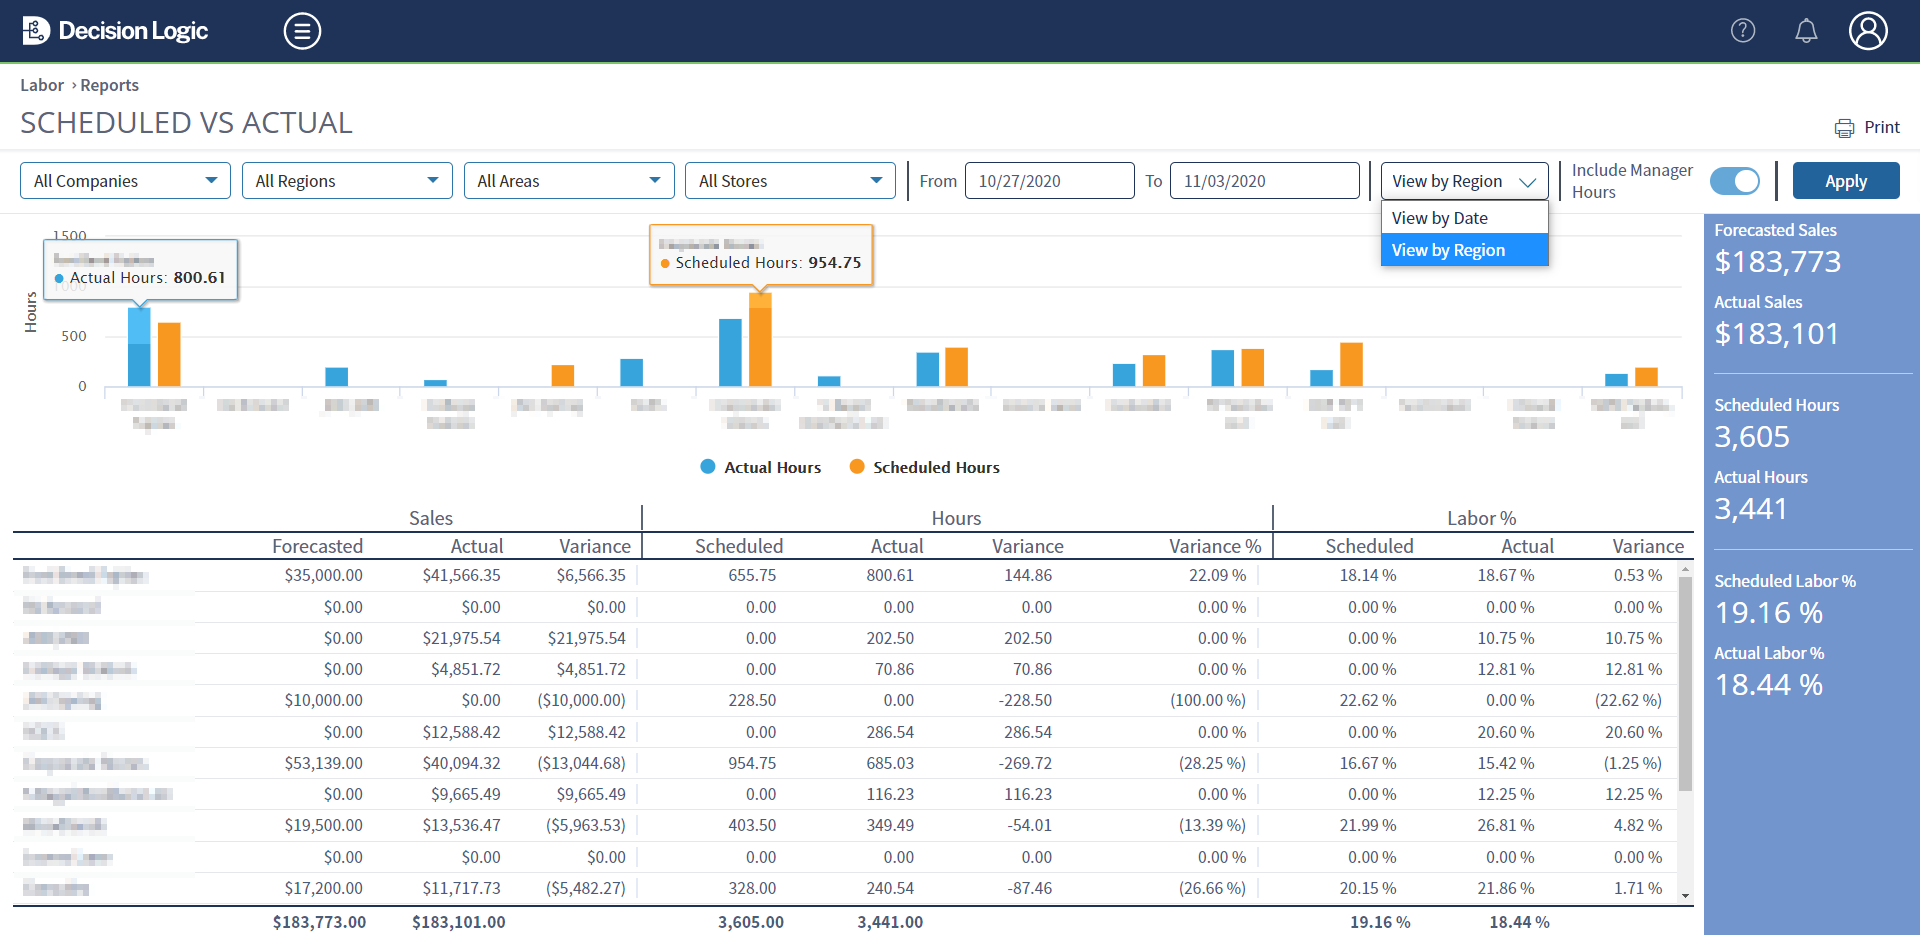
View by Region
The View by Region option provides an overview of each region and allows users to dive deeper into the details. The data available is the same as view by date, except with this option, you are viewing by region. Users can view sales, labor in hours, and labor percentages. The side panel has a quick overview of the sales, labor, and overtime (OT). Users can toggle between the Dollars and Hours view on the panel. The default view will be Dollars.
Example Report.
Single-Store Users: View Report
This section will walk through the different view options for users with access to a single store. The navigational steps to access the Labor SvA page are the same for all view options. Being by navigating to:
Reports > Labor > Labor SvA
The Company, Region, Area, and Store are selected by default.
Select a Date or Date Range.
Un-toggle Enforce Weeks to select an individual date.
The green dot under a date represents the beginning of the store’s labor calendar.
Period Start is the beginning of that store’s period.
Select the View option.
View by Date: displays forecasted and actual sales and labor by the date or date range selected.
View by Store: provides projected labor thresholds in hours per store and an overview for each store assigned to your profile.
View by Shift: displays scheduled and actual labor hours when the Labor Scheduler is used to create schedules.
View by Hour: breaks down how each hour of the day contributes to overall labor.
View by Employee: shows each employee of the selected store their scheduled, actual, and projected labor hours with details on the clock in and out times.
Toggle Include All Jobs if you'd like to include all jobs.
By default, only jobs marked “include” in POS Admin will be shown.
You can skip this step if you do not want to include all job hours in the report.
Click Apply.

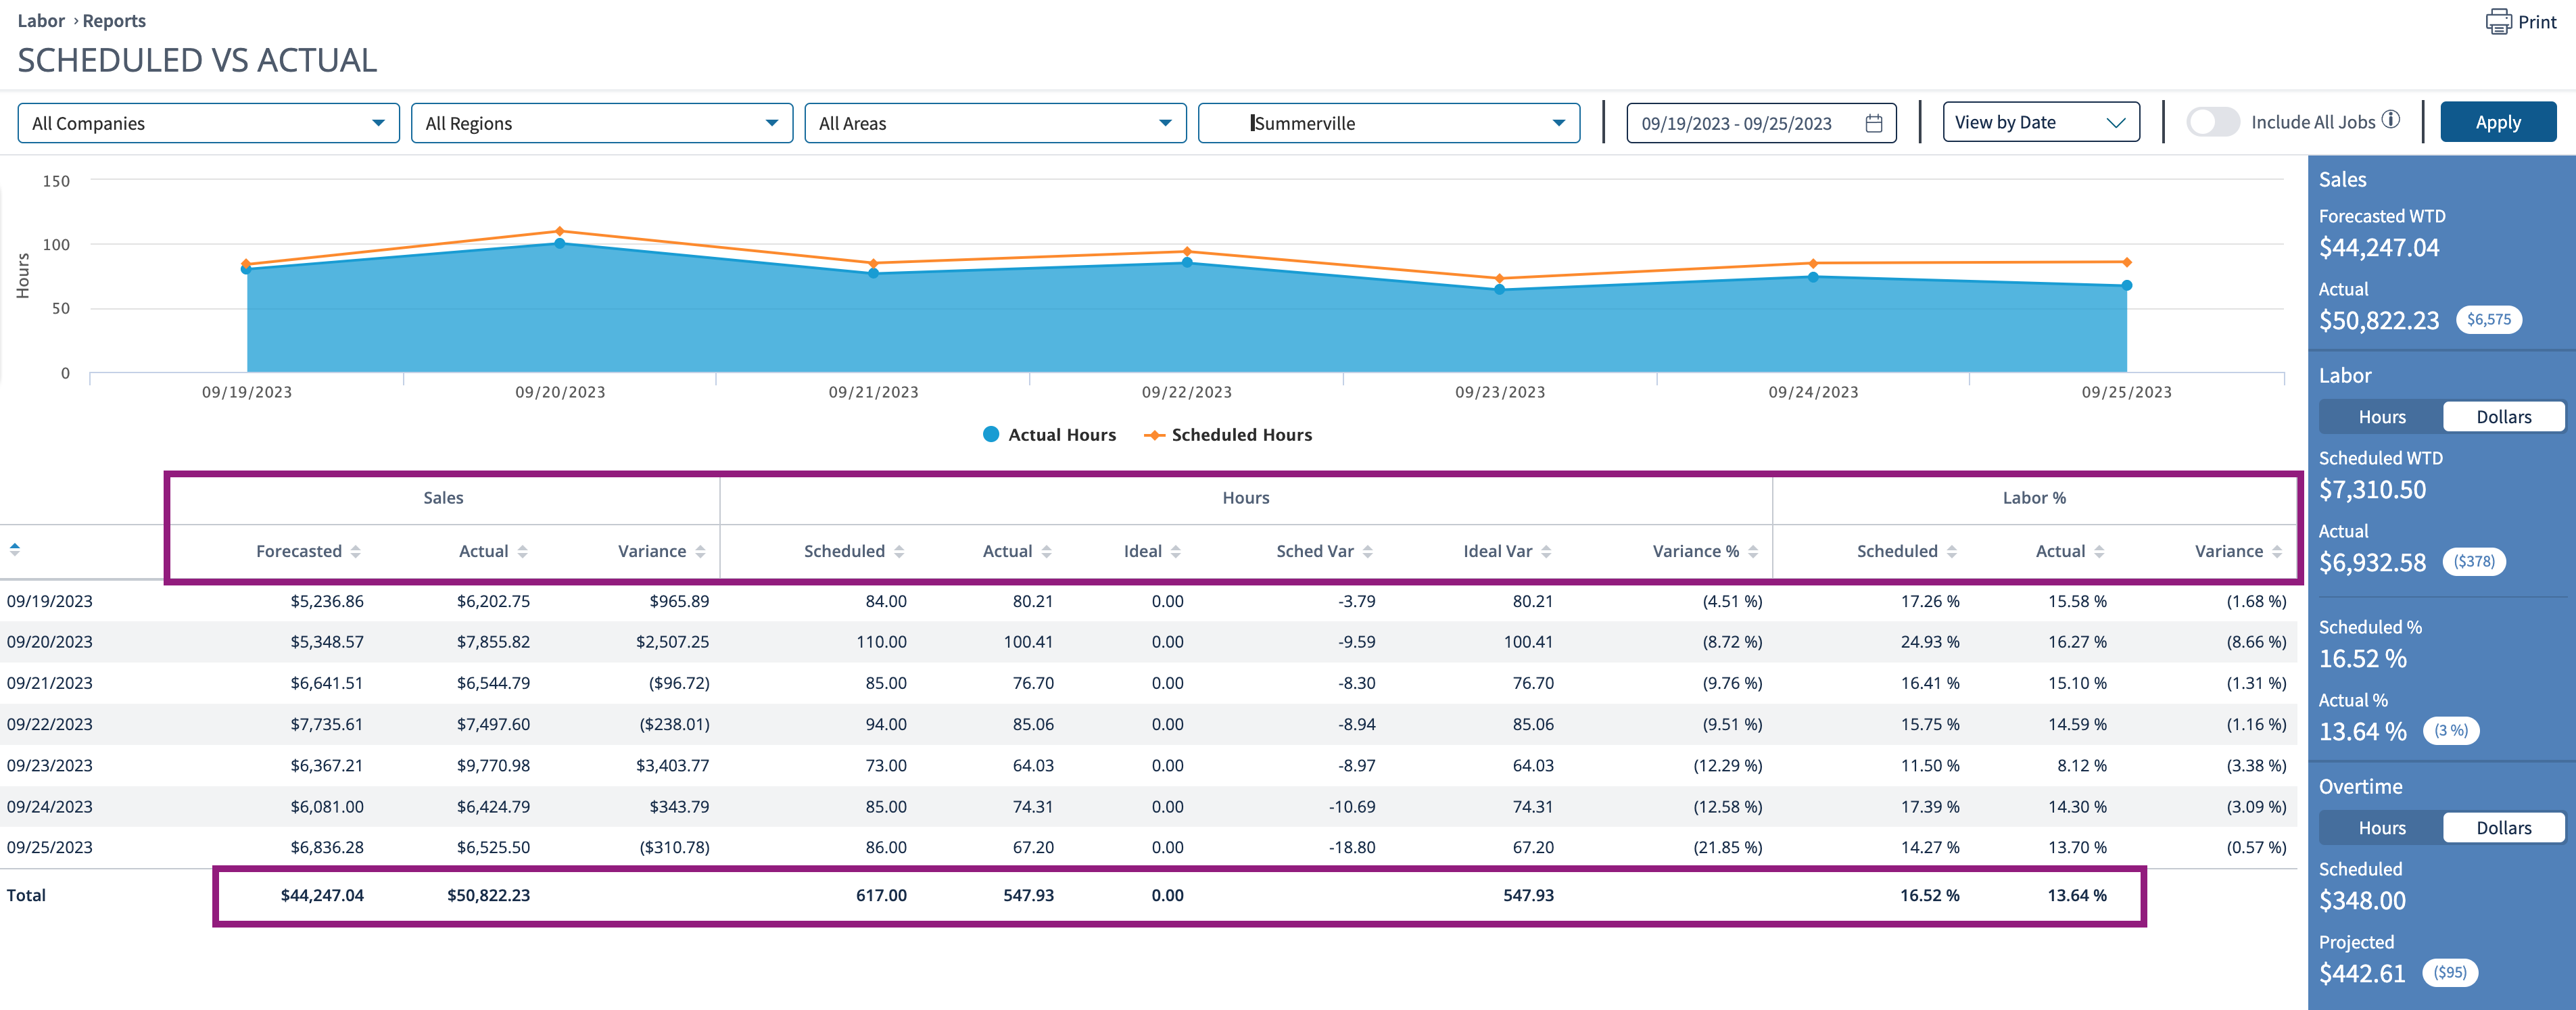
View by Date
The View by Date option displays the same information for single- and multi-store users. It shows the forecasted and actual sales and labor by the date or date range selected. Results reveal a trend line for the Actual vs. Scheduled Hours, date(s), sales, hours, labor percentage (%), and totals for the three categories on the bottom. Users can interact with the graph by selecting or unselecting Actual Hours or Scheduled Hours.
The side panel shows:
A quick overview of the Total forecasted and actual Sales by dollar amount.
The Labor data in Hours and Dollars and the variance between the two. The default view is Dollars. Click Hours to toggle to the Hours view.
The Labor data for Scheduled and Actual labor percentages and the variance between the two.
The scheduled and projected Overtime in Hours and Dollars. The default view is Dollars. Click Hours to toggle to the Hours view.
The Sales category shows:
Forecasted and Actual sales in dollars.
The variance between Forecasted and Actual sales in dollars ($).
Total forecasted and actual sales.
| Info |
|---|
Variance is Actual Sales - Forecasted Sales |
The Hours category shows:
Scheduled labor hours were created using Decision Logic's Labor Scheduler feature. Some businesses may include manager hours when selecting the parameters to show data.
Actual labor hours of how many employees clocked in/out and may include manager hours if selected.
Scheduled Variance of labor hours as a number.
Variance is displayed as a percentage (%) of the Scheduled Variance.
| Info |
|---|
Schedule Variance is Actual Hours - Scheduled Hours |
The Labor % category shows:
Scheduled and Actual hours as a percentage of Forecasted and Actual Sales, respectively.
The variance between the Schedule Labor % and Actual Labor %.
| Info |
|---|
Variance is Actual % - Scheduled % |
Users can filter the column by hovering their mouse and clicking the arrow that appears.
Example Report.
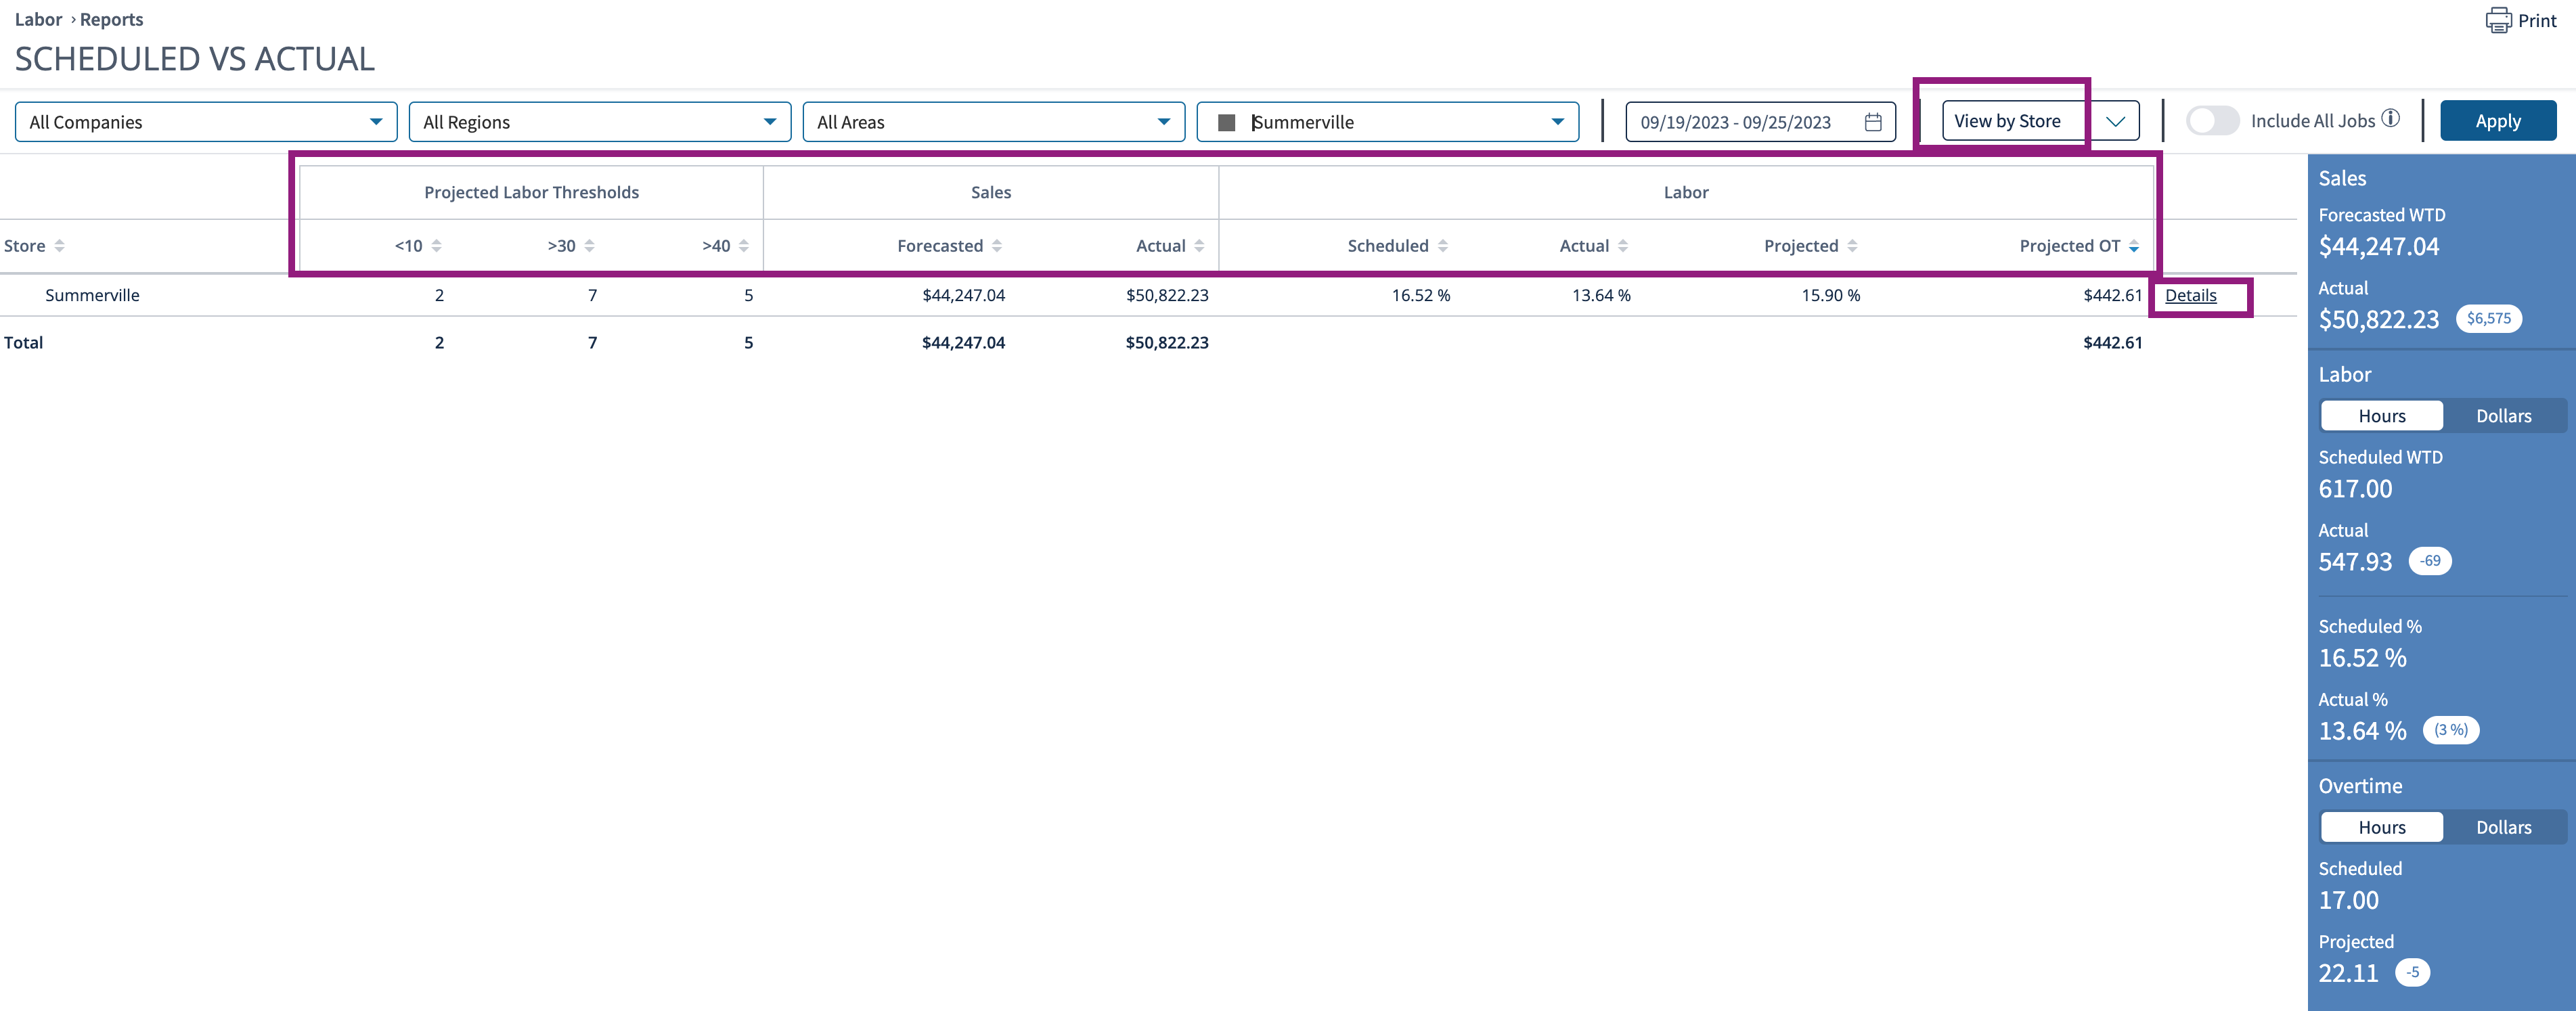
View by Store
This view allows single-store users to see how their stores are performing. The default view of stores is listed by projected overtime (OT) in dollars. Users can sort the list based on any available column by hovering their mouse over it and using the arrows to sort.
Projected Labor Thresholds give insight into how many employees are scheduled for less than ten hours, greater than thirty hours, and greater than forty hours. This information can help with employee retention by identifying over and under-utilized employees.
The Sales section shows forecasted and actual sales for the selected store.
The Labor section shows the percentages of scheduled, actual, and projected labor and projected overtime in dollars.
The Details links let you dive deeper into a store’s labor data by providing a slide-out to view each employee's information. Information includes the employee’s name, hours category (threshold), shifts remaining, scheduled hours, week-to-date hours, projected hours, and projected overtime. Additionally, you can filter the data by projected labor thresholds.
| Info |
|---|
Projected Hours = Actual Worked Hours + Remaining Scheduled Hours. |
The Side Panel show sales, labor in hours and dollars, and overtime in hours and dollars. The default view is in ‘Hours.’
The bottom row shows the totals for their respective columns.
Example Report.
Details View Example.
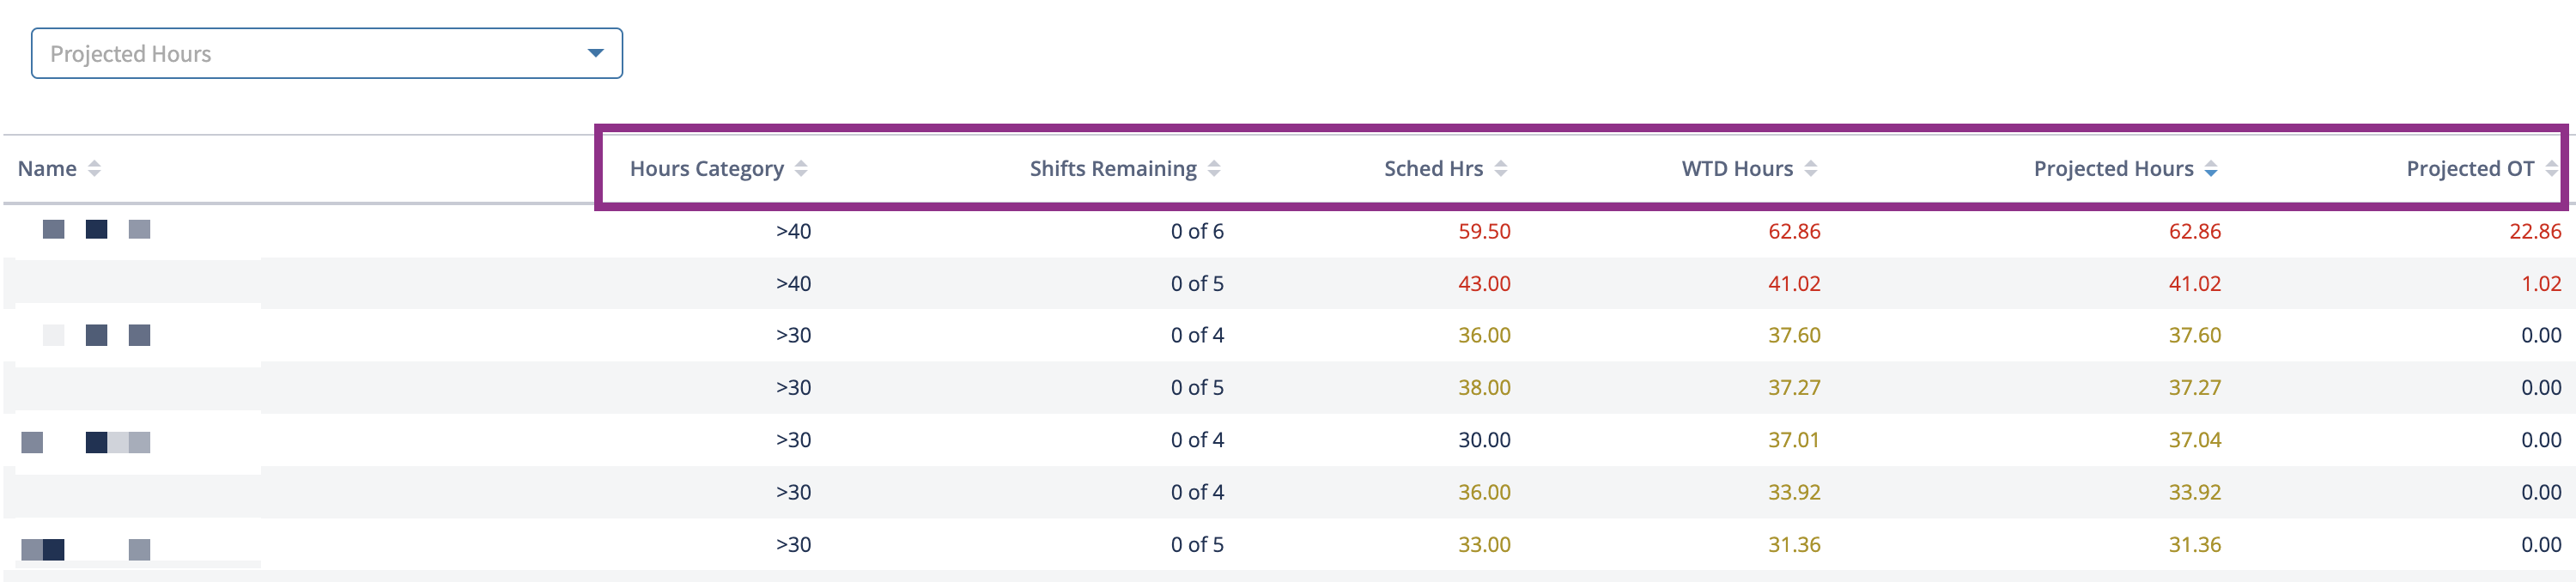
| Info |
|---|
Projected Hours = Actual time worked + Scheduled time not yet worked. |
View by Hour
The View by Hour option shows sales, hours, and labor percentage by the hour. The ‘How do I view hourly sales & labor in the Labor SvA report?’ article provides a deeper dive into the displayed data.
Example Report.

| Info |
|---|
|
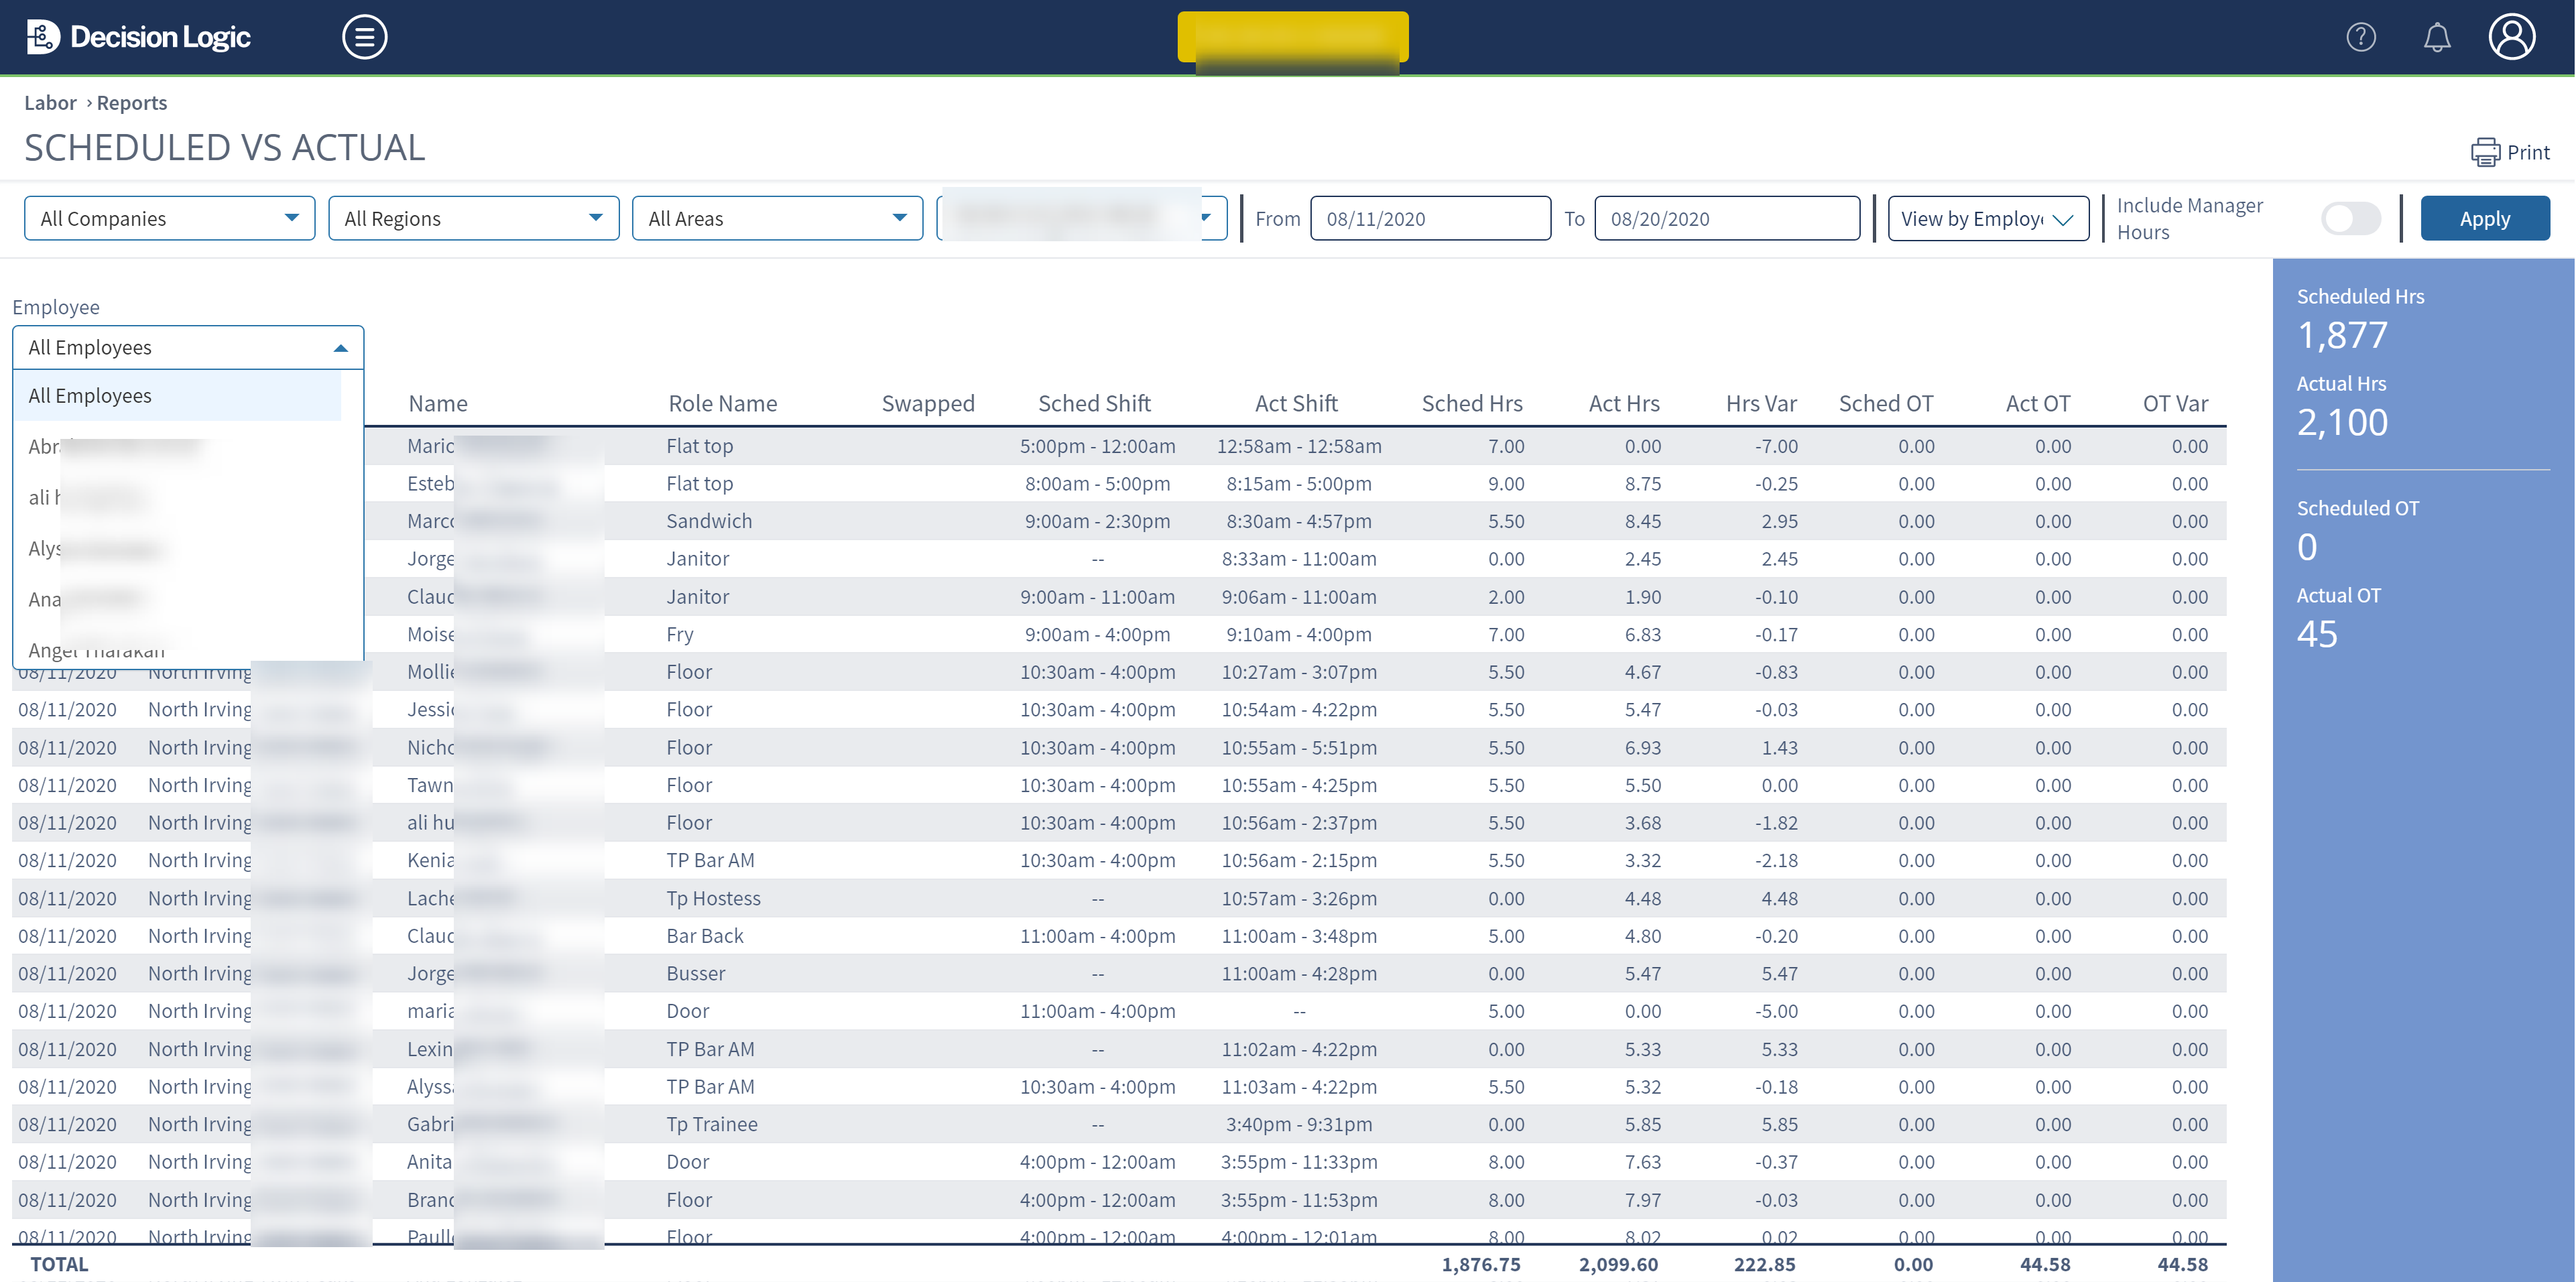
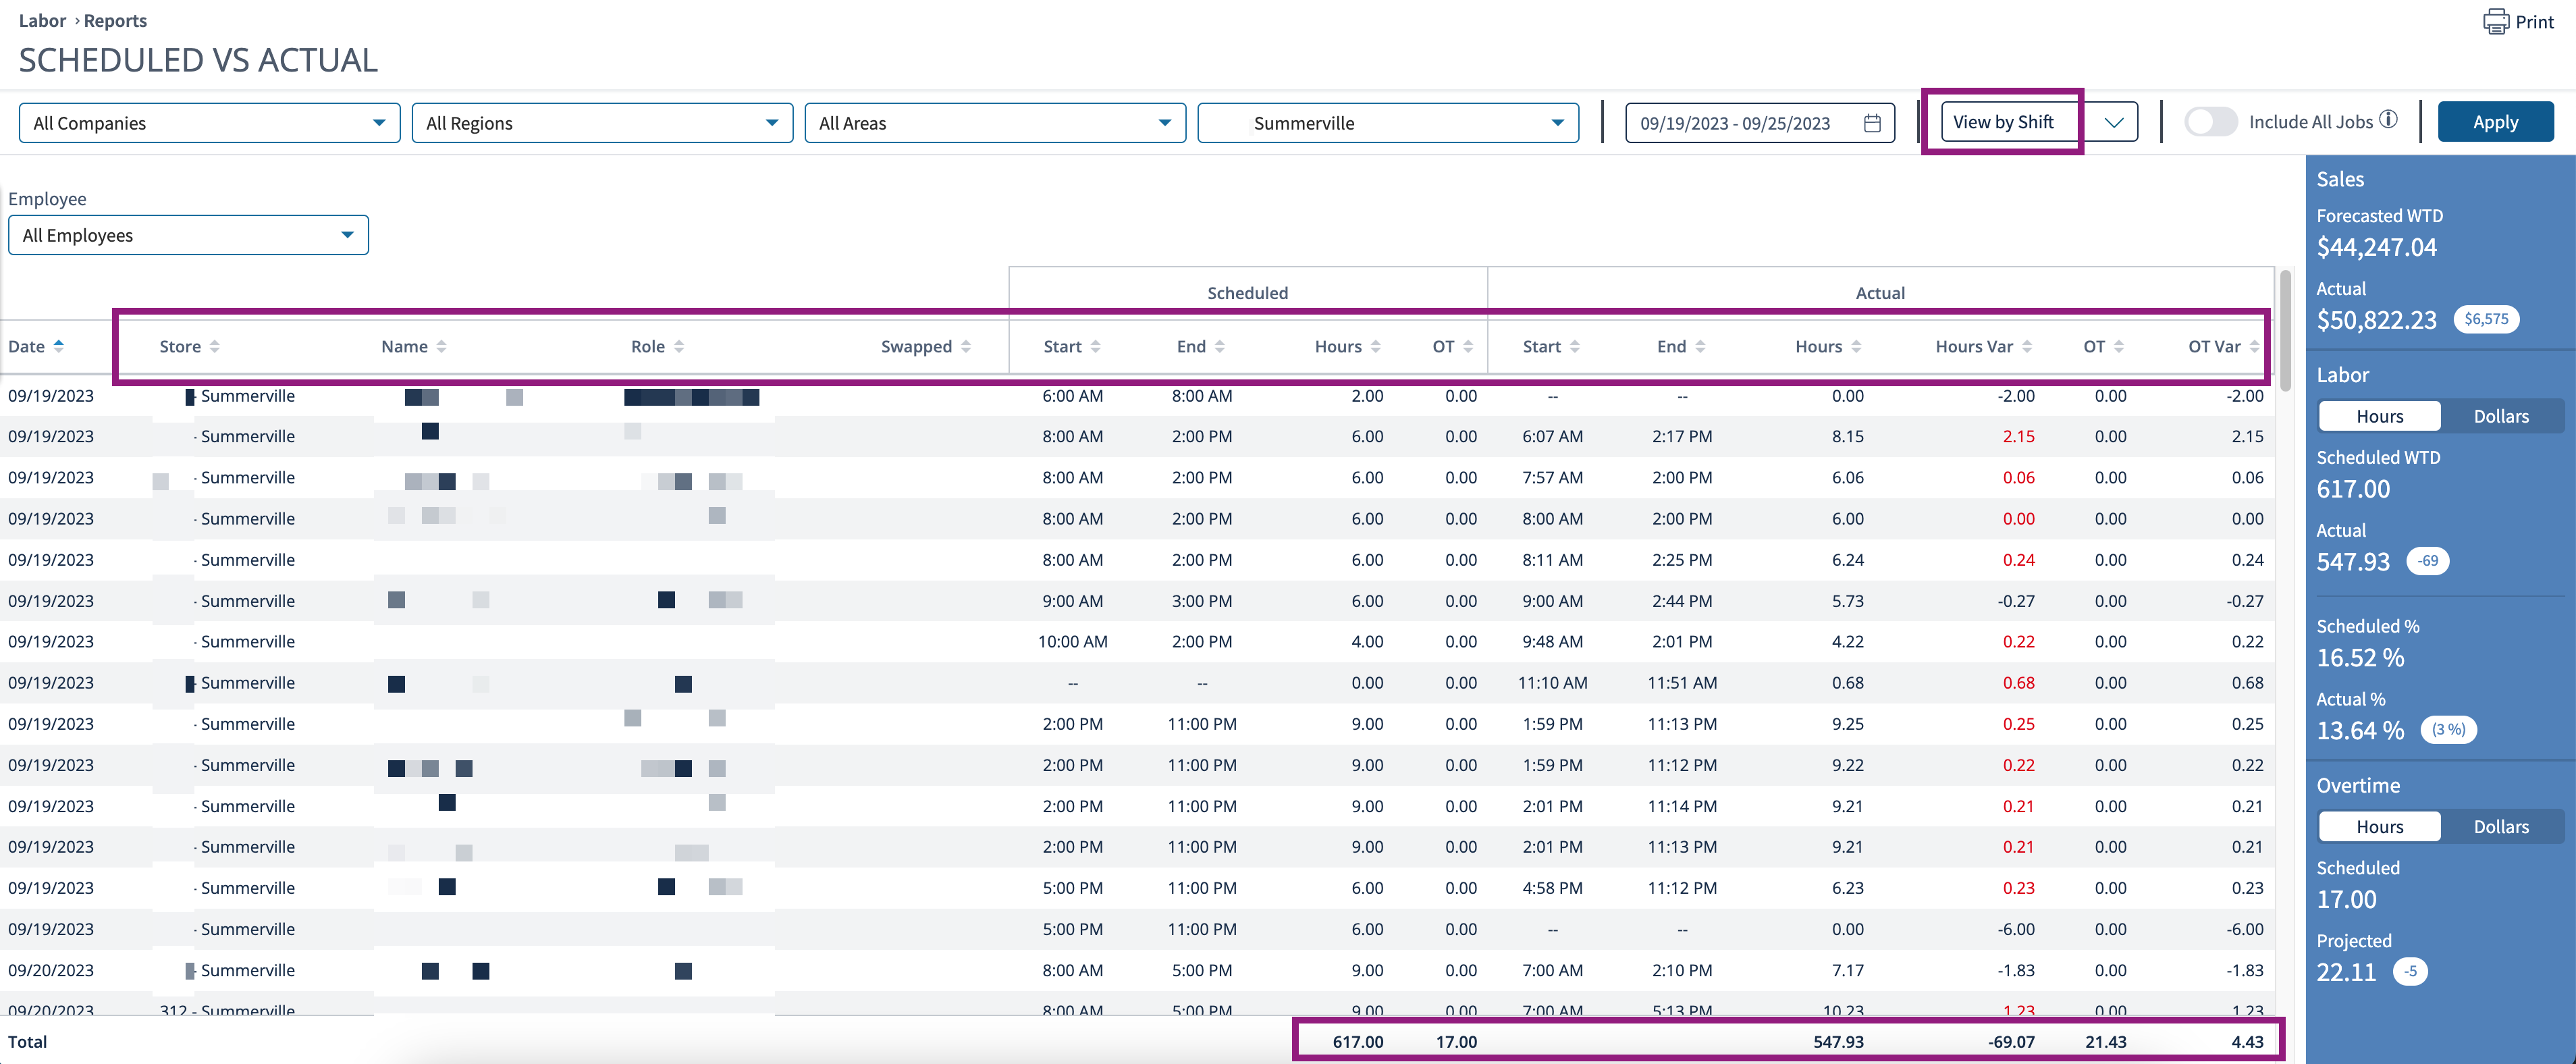
View by Shift
The View by Shift option displays the same information for single- and multi-store users. In addition, viewing by shift shows information regarding a scheduled vs. actual shift when the Labor Scheduler is used to complete schedules. This includes:
The date.
The store(s) name.
The employee’s name.
The employee’s role.
If the employee swapped a shift.
When the employee was scheduled to start and end their shift.
The hours the employee was scheduled.
If an employee were scheduled overtime (OT).
When the employee started and finished their shift.
The hours the employee worked.
The variance between the hours the employee were scheduled and the actual hours they worked.
Any overtime (OT) worked.
Any overtime variance between what they were scheduled and what they worked.
Managers can search for an individual employee rather than scrolling through the list. Managers can also sort any column by clicking the arrow next to the column. Hover your mouse until the arrow appears.
The side panel provides sales, labor, and overtime data in hours and dollars. The “hours” view is selected by default.
| Info |
|---|
Decision Logic recommends choosing individual stores for the best data display. |
Example Report.
A notification will appear if there is an unmapped employee or if an action must occur. The manager should resolve the notification before posting the store payroll.

View by Employee
The View by Employee allows managers to dive deep into the details of an employee’s labor metrics. Each employee listed will have the following:
Shift remaining to work out of the shifts they were scheduled.
Scheduled hours and overtime hours.
Actual hours worked week-to-date and variance in hours.
Projected hours and overtime hours.
Details into when employees clocked in and out.
Totals of their respective columns.
Example Report.

| Info |
|---|
Projected Hours = Actual time worked + Scheduled time not yet worked. |
Details view example.

| Info |
|---|
Projected Hours = Actual time worked + Scheduled time not yet worked. |
© 2023 Knowledge Management Systems, LLC. Decision Logic. All Rights Reserved.