This article provides recommendations to managers on forecasting schedules and labor.
Overview
Activity-Based Scheduling allows managers to base their labor Labor % on projected sales for their specific department sales and allows for a per schedule analysis to cut labor expenses. For example, this would be useful if
I amyou were writing a Back-of-House (BOH
schedule and I want my projected sales to only reflect that of the Food department(s)) schedule and wanted to see the generated sales projections, which would only reflect the Food departments.
Activity
Based Scheduling allows the manager more control in having-Based Scheduling helps managers have the right people on staff
for the right volume and sales that the area of the restaurant is going to produce., calculate an accurate server-to-customer ratio, and analyze the anticipated sales down to each department.
Schedule Forecasts
Consider the scenario where a manager wants the Kitchen and Server schedules to be based on different other department sales.
The table below lists three departments, the department sales, and an “X“ indicating if that department will be included in a schedule’s projection metrics.
The sum of all department sales will equal the total sales for the entire store.
Each schedule sales value will be less than or equal to the store-wide sales.
Department | Department Sales | Kitchen Schedule | Server Schedule |
|---|---|---|---|
Food | $1000 | X | X |
Liquor | $500 | X | |
Catering | $250 | X | |
Total Sales | $1750 | $1250 | $1500 |
Instead of using department sales directly, our system calculates averages over
six weeks, ending with the last date of recorded sales.
An average is calculated for each day of the week. For example, an average
is calculated for
six consecutive Mondays
.
For each day of the week grouping, we remove outliers that are more than one standard deviation away from our mean.
Labor Departments
These The departments are configured in using the Labor Setup page in Decision Logic:


Once these departments are configured in Labor Setup, it’s time to create a schedule.
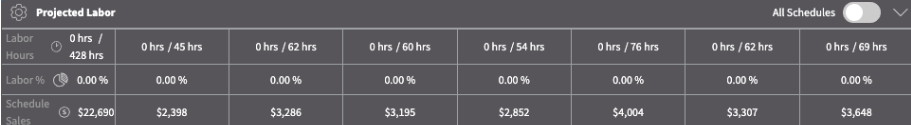
When a new schedule is created, the projections panel at the bottom of the page will
display the Schedule Sales
.
These are
the sales
sum determined by how the Labor schedule's departments have been set up.
Toggling the “All Schedules” switch will display the store-wide sales instead.
Schedule Overrides
Sometimes, a manager may want to adjust the Schedule Sales value that their Labor Percent is calculated from. In this case, a manager can adjust the Target Sales value found in the Projections modal.

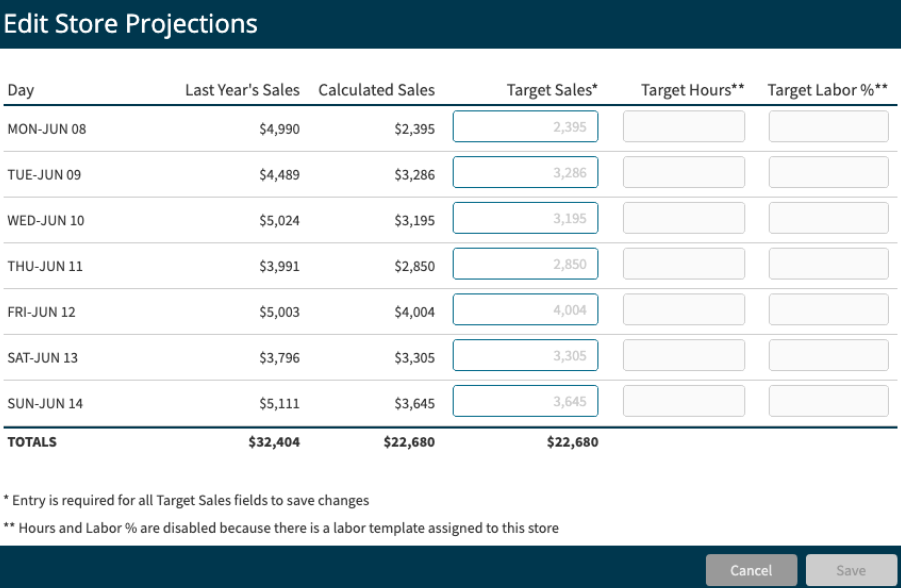

If you do not want to manually update the Sales Forecasts, you can select Generate sales, and all projected sales will be used.
Labor Forecasting:
Updating the Targeted Sales on the Sales Forecasting page will affect all schedules.
When a Target Sales value is set for a day, a
‘department sales
override’ value is created for
each department.
This generated amount is proportional to the percent that the department sales make
of
the store’s total sales.
Department | Department Sales | Department Sales Override |
|---|---|---|
Food | $1000 | (1000 / 1750) * 2000 = $1142.86 |
Liquor | $500 | (500 / 1750) * 2000 = $571.43 |
Catering | $250 | (250 / 1750) * 2000 = $285.71 |
Total Sales | $1750 | $2000 |
When viewing the Projections section at the bottom of Labor Scheduler, the Schedule Sales values will update accordingly:.
Department | Department Sales Override | Kitchen Schedule | Server Schedule |
|---|---|---|---|
Food | $1142.86 | X | X |
Liquor | $571.43 | X | |
Catering | $285.71 | X | |
Total Sales | $2000 | $1428.57 | $1714.29 |
Table of Contents
| Table of Contents |
|---|
| Info |
|---|
For additional questions or assistance |
, please submit a support ticket by |
visiting the Decision Logic |