Getting Started
Each unique users can create custom reports that can be saved. When logged in, users can only view the custom reports they created.
Create a New Custom Report
Select New Report. This will bring you to a new page.

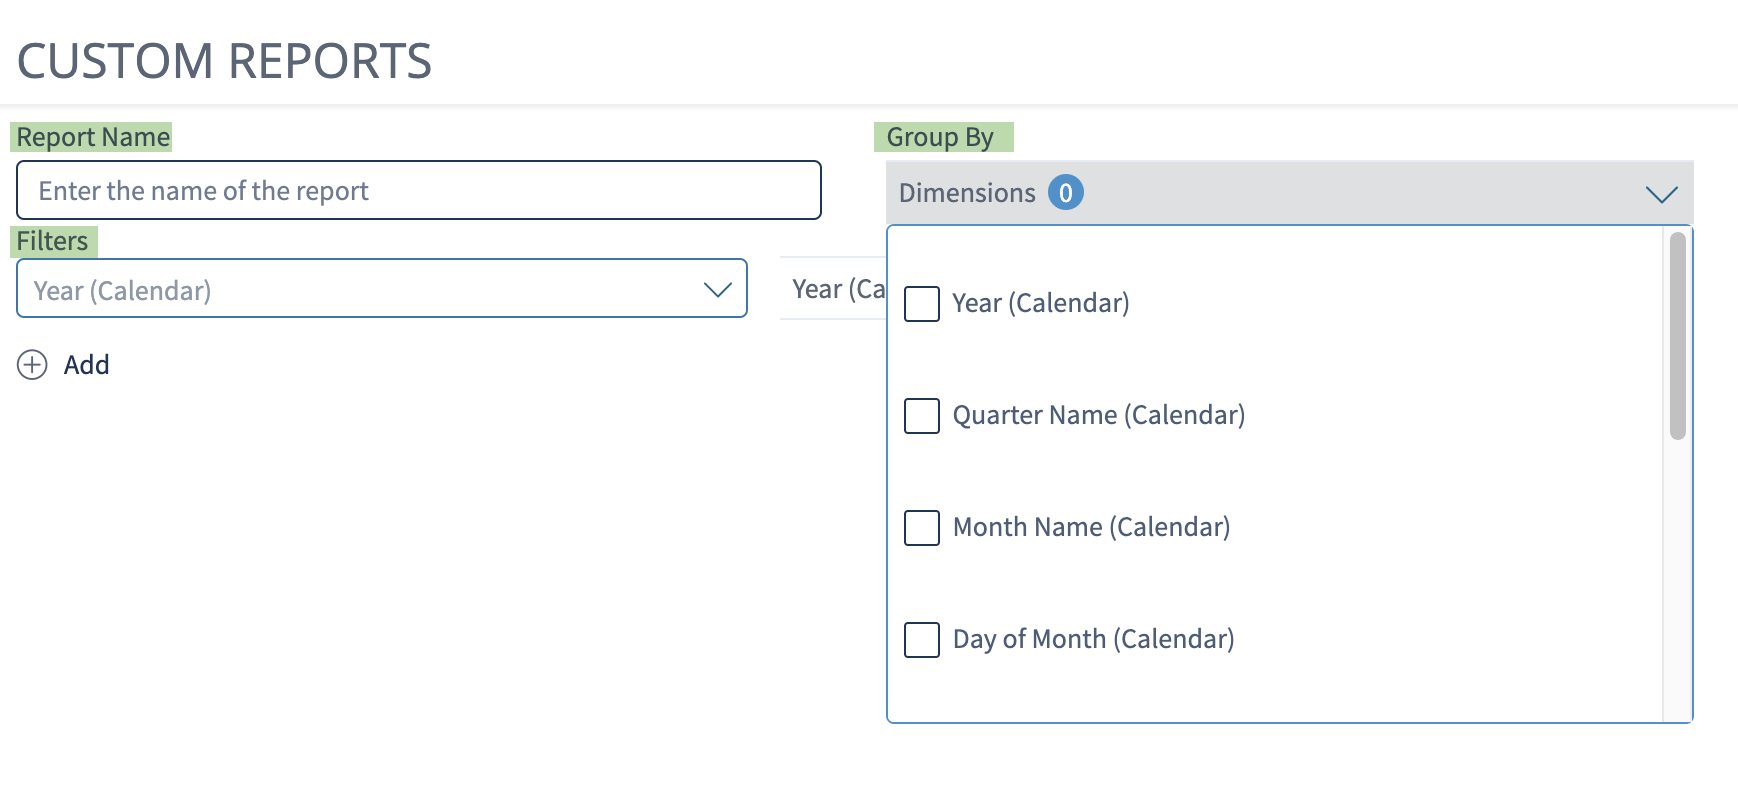
Fill out the Report Name field with a name that describes the type of report you are building.
Select
Filters you would like to be applied to the report. Filters will narrow the results returned in the report.
Once a type of filter is selected, a new dropdown will appear.
Users are able to add more than one filter to these reports. These are typically used to filter dates that are shown or specific sets of stores needed to be shown.
 Sites using V6 will be able to select date filters while non-V6 clients will select dates using Weeks, Periods, and Years
Group entries using the Group By dropdown menu. This dictates the order and groupings your report is shown.
Add
Metrics you want to see on this report. These fields can vary. You are able to add many metrics to your report as needed.
Verify the information in the report using the Preview button before Saving it. This will produce a sample of the report. You will see graphs and charts visualizing the data selected.
Select Save.

This will bring you back to the Custom Reports page. You will see your report in the column to the left side.
Edit an Existing Report
Select an existing report.
Click the Edit icon in the top right corner of the screen. This will bring you to the same menu used when creating the report but contains the current configuration of the report.
Make the necessary edits.

Export a Report
You are able to export any existing custom reports to CSV.
Select
Export
in the upper right corner.

Your report will download as a CSV file.