Versions Compared

Key

  • This line was added.
  • This line was removed.
  • Formatting was changed.

How to Get There

Reports > Cost and Variance > Cost of Goods Sold

The Cost of Goods Sold page is most commonly used for:

  • Reviewing Cost of Goods as a percentage of sales

  • Reviewing Account Category cost of goods sold totals based on your site's configuration

  • Reviewing high level COGS information for all ingredients

  • Reviewing detailed COGS information for individual ingredients

  • Providing actionable data to store level managers about improving the cost of goods sold

What Pages Affect the Cost of Goods Sold Report?

  1. Inventory

    1. Inventories posted from Inventory Home and DDM Inventory will be used as the Beginning and Ending Inventory on the COGS report page.

  2. Ordering Home

    1. Orders and Manual Receives posted using Ordering Home will show up as a purchases on the COGS report.

    2. Tip: Be sure you receive the orders for the same week they are received at the store.

  3. DSR

    1. Cost of Goods can be configured to pull in Net or Net-Net Sales from the DSR (Daily Sales Report). If you are unsure if your company has set Cost of Goods to use Net or Net Net contact your Decision Logic Administrator, Account Manager, or Helpdesk.

Does this interact with other parts of Decision Logic?

  • The Shelf Extensions page shows similar information about the week’s beginning inventory.


Table of Contents

Table of Contents
maxLevel3
absoluteUrltrue
Info

Unable to access this page in Decision Logic?

  • You can contact your Decision Logic Administrator to make Scope and Security adjustments to your user profile.

  • Some pages are client-specific. You can contact your Decision Logic Account Manager to assist with adding new pages.

Calculations

Cost of Goods Calculation

The formula for calculating COGS is:

  • Beginning Inventory $ + Purchases $ - Ending Inventory $ = Usage $

The formula for calculating COGS % of sales is: 

  • Usage $$ Total / Total Sales for that category = % of Sales for that Category

(warning) Depending on your site’s configuration, the Cost of Goods Sold report uses one of the following sales values:

  • Net Sales

  • Net Net Sales


How to Use This Page

Select Parameters

  1. Define your Company, Region, Area or Store byusingthe drop-down. Store level users will only see their store and will not be able to select other stores

  2. Select From and To dates from the calendars. Click the Apply button.
    Choose From and To dates that correspond to your inventory calendar.

Image RemovedImage Added

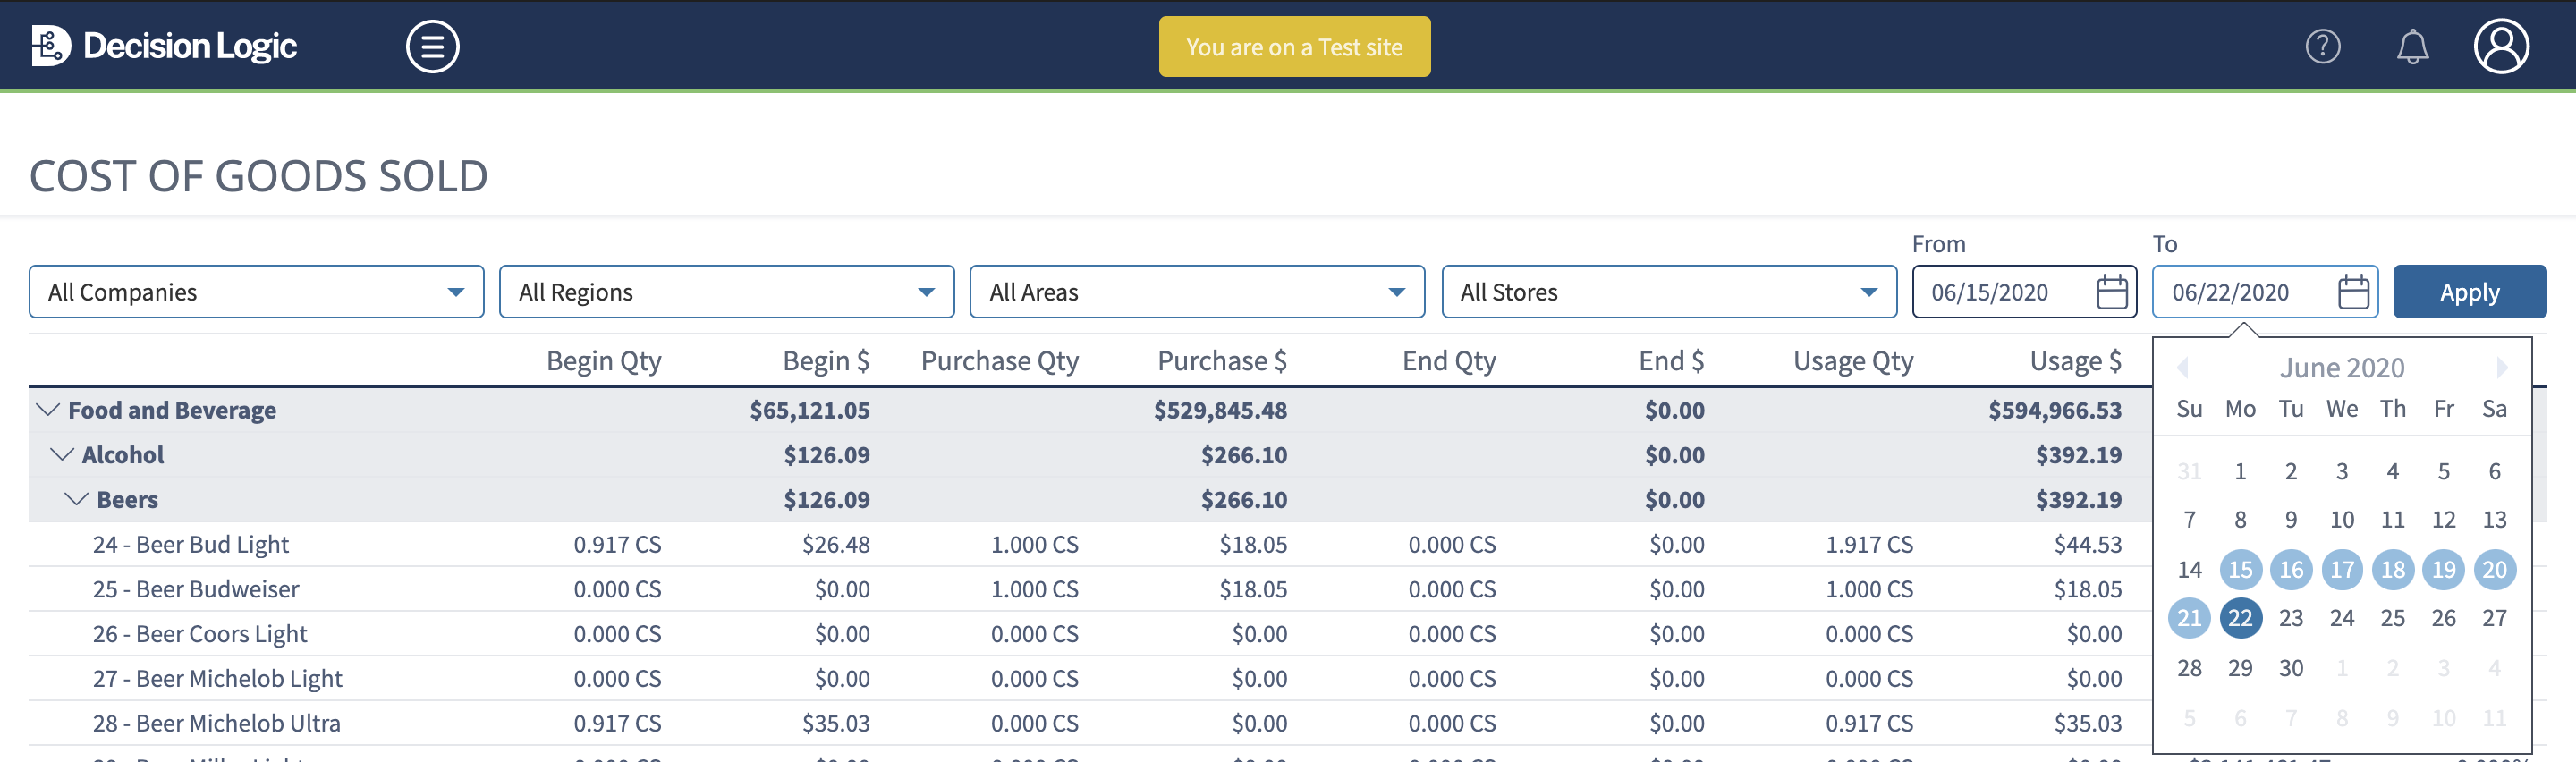
After clicking the Apply button, the Cost of Goods Sold Report will show the configured Account Categories. You will see the following columns for each ingredient:

  • Beginning Qty - Beginning Inventory count converted to cases

  • Begin $ - Value of the beginning inventory

  • Purchase Qty - Purchase quantities converted to cases

  • Purchase $ - Value of the purchases

  • End Qty - Ending Inventory count converted to cases

  • End $ - Value of the ending inventory

  • Usage Qty - Begin Qty + Purchase Qty - End Qty

  • Usage $ - Begin $ + Purchase $ - End $

  • Total Sales - Department sales which are mapped to the Account Categories

  • % Sales - Usage $ / Total Sales
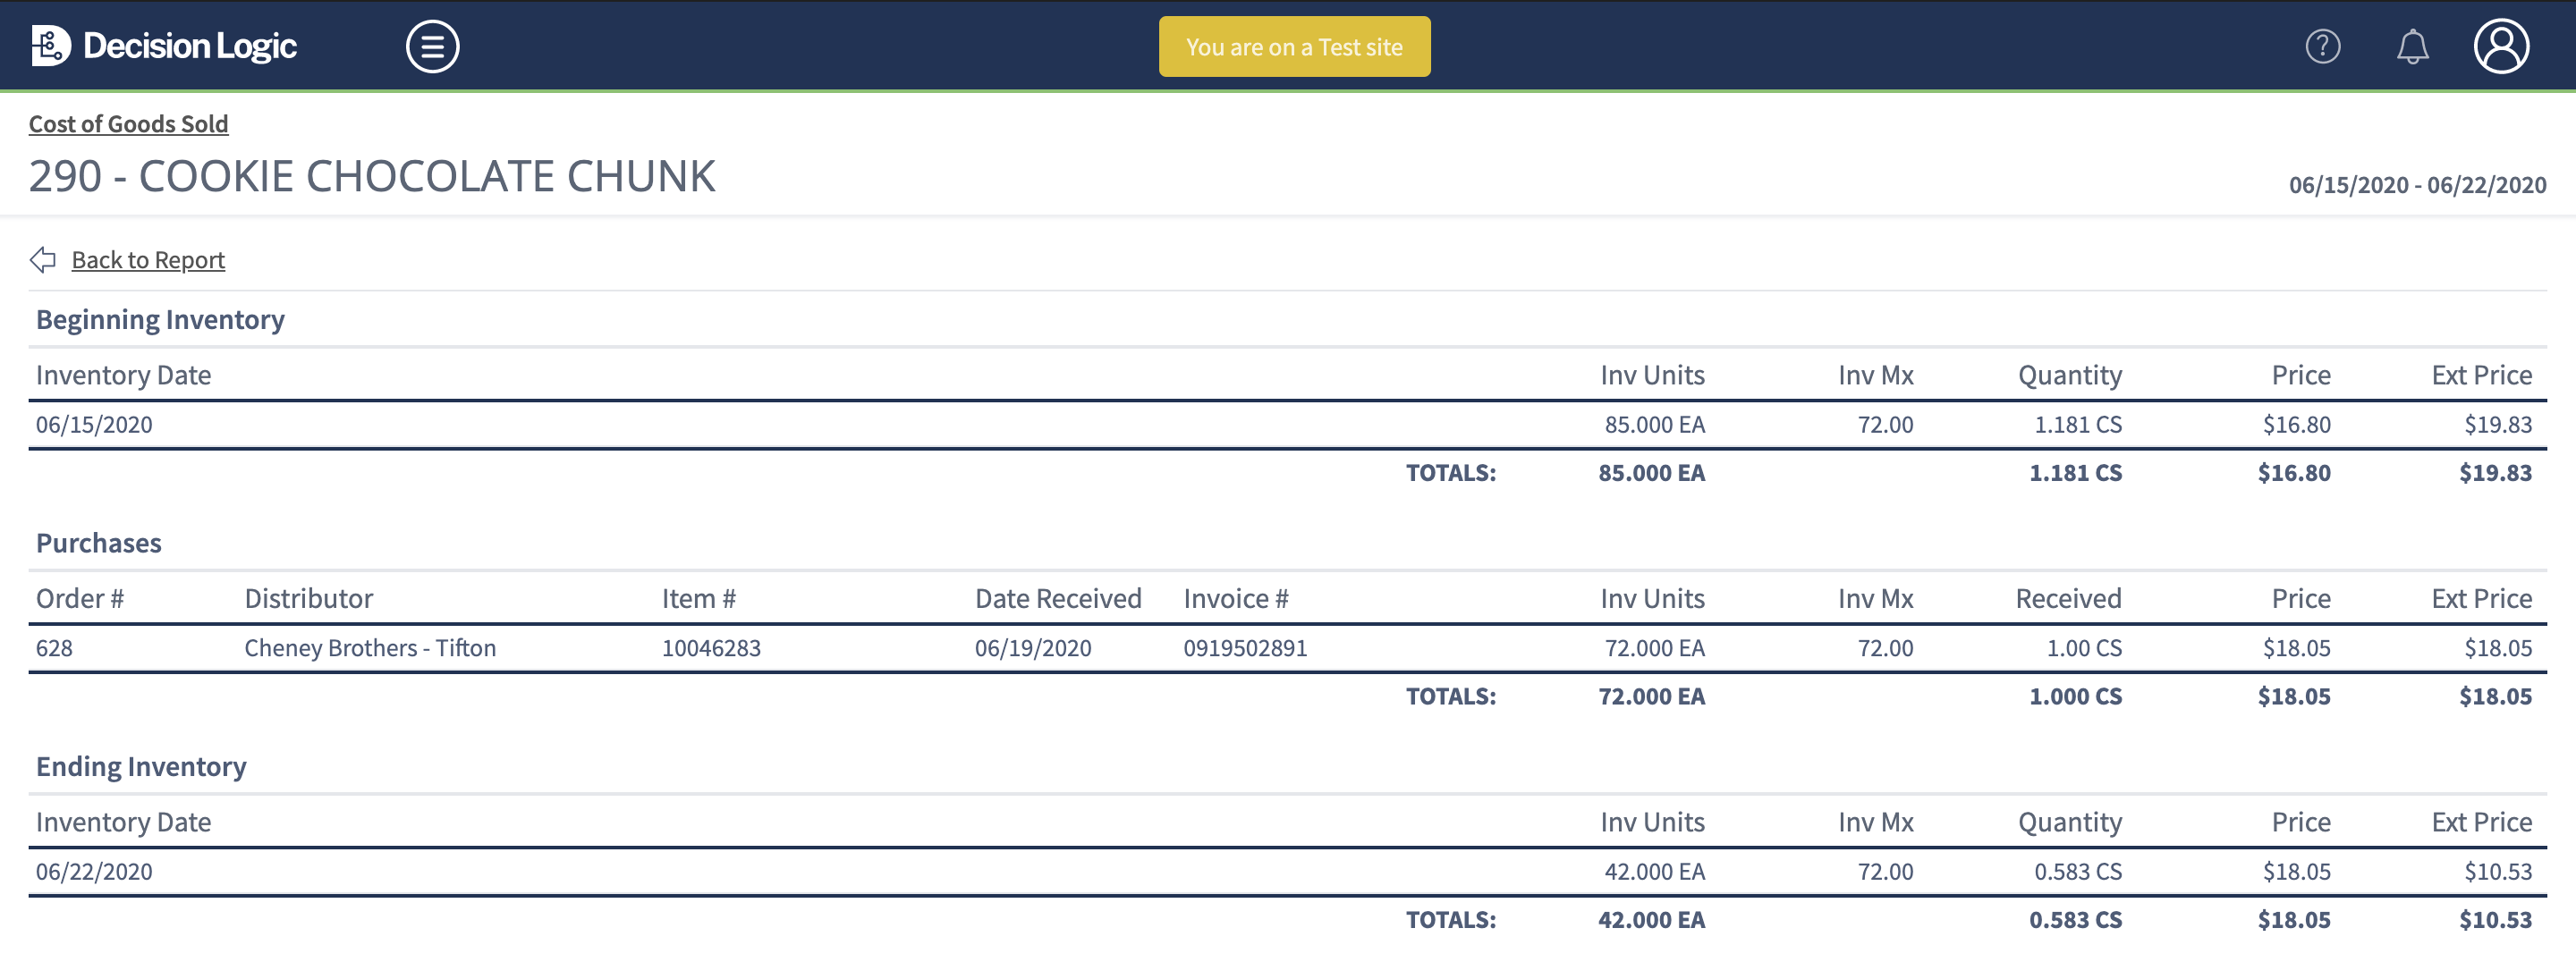
Item Detail

  • To dial into a single item, click on the item description. This will take you to a new item detail page shown below.

  • This page provides the same information as the old pop-out view but now on an individual page.

    • Metrics

      • Inv Units - the quantity of product reported in inventory measurements as posted from Inventory.

      • Inv MX - defined in the Bid File for specific dc item # assigned to the Stores' Order Guide.

      • Quantity - calculated amount of Inv Units / Inv MX

      • Price - based on the Bid File for specific dc item # assigned to Stores' Order Guide.

      • Ext Price - calculated as Quantity * Price

  • To return to the Cost of Goods Sold report you can click Back to Report or Cost of Goods Sold both in the top left corner of the page.

Image RemovedImage Added


Frequently Asked Questions

Researching Variance Issues

When reviewing variance reporting it is best to research as soon as possible after an inventory is recorded and entered into Decision Logic. 

When users find items with a large variance take the following steps to help find a solution:

  • Find high variance items in Decision Logic 

  • Confirm both beginning inventory and ending inventory values are correct 

  • Review purchases to be sure all product was received at the correct quantities and price

  • Review ideal usage to be sure all product is depleting at the correct quantities (reminder: ideal usage is calculated directly from product mix reporting that is pulled from the POS System, depletion quantities are entered into menu maintenance in DL)

  • If all data entered into Decision Logic is correct and all values are depleting properly take into consideration the following:

    • over portioning

    • under portioning

    • theft

    • waste issues

COGS has missing sales data

If your sales data is not reporting on the COGS report, please note the following:

  • Decision Logic may not have received the sales data last day of the week at the time that inventory was posted.

    • Check the DSR or Missing Files page to see if all data is in Decision Logic. If there is missing data, run the UDT Client for the missing dates. If the data is on the DSR, run DL Updates COGS update for the current week.

  • Inventory may not be posted.

    • Ensure that all inventories are posted for the date range you selected.

💛 Note, posting inventory runs a COGS update to run for that current week, therefore you will not need to run a DL Update.


Related Articles

Filter by label (Content by label)
showLabelsfalse
max8
showSpacefalse
cqllabel = in ( "cogs" , "order" , "bid_file" ) and space = "CKB"