How to Use This Page
Select Parameters
Define your Company, Region, Area or Store byusingthe drop-down.

Select From and To dates from the calendars.
⚠ The old report displays from the first inventory date to the day before the next inventory date so in order for both reports to be running for the same inventories the new report end date should be one day after the old report. For example: on the previous version of the report IvA would run 08/03/2020 - 09/06/2020. Matching dates selected for the Multiple Calendar version of this report would be 08/03/2020 - 09/07/2020

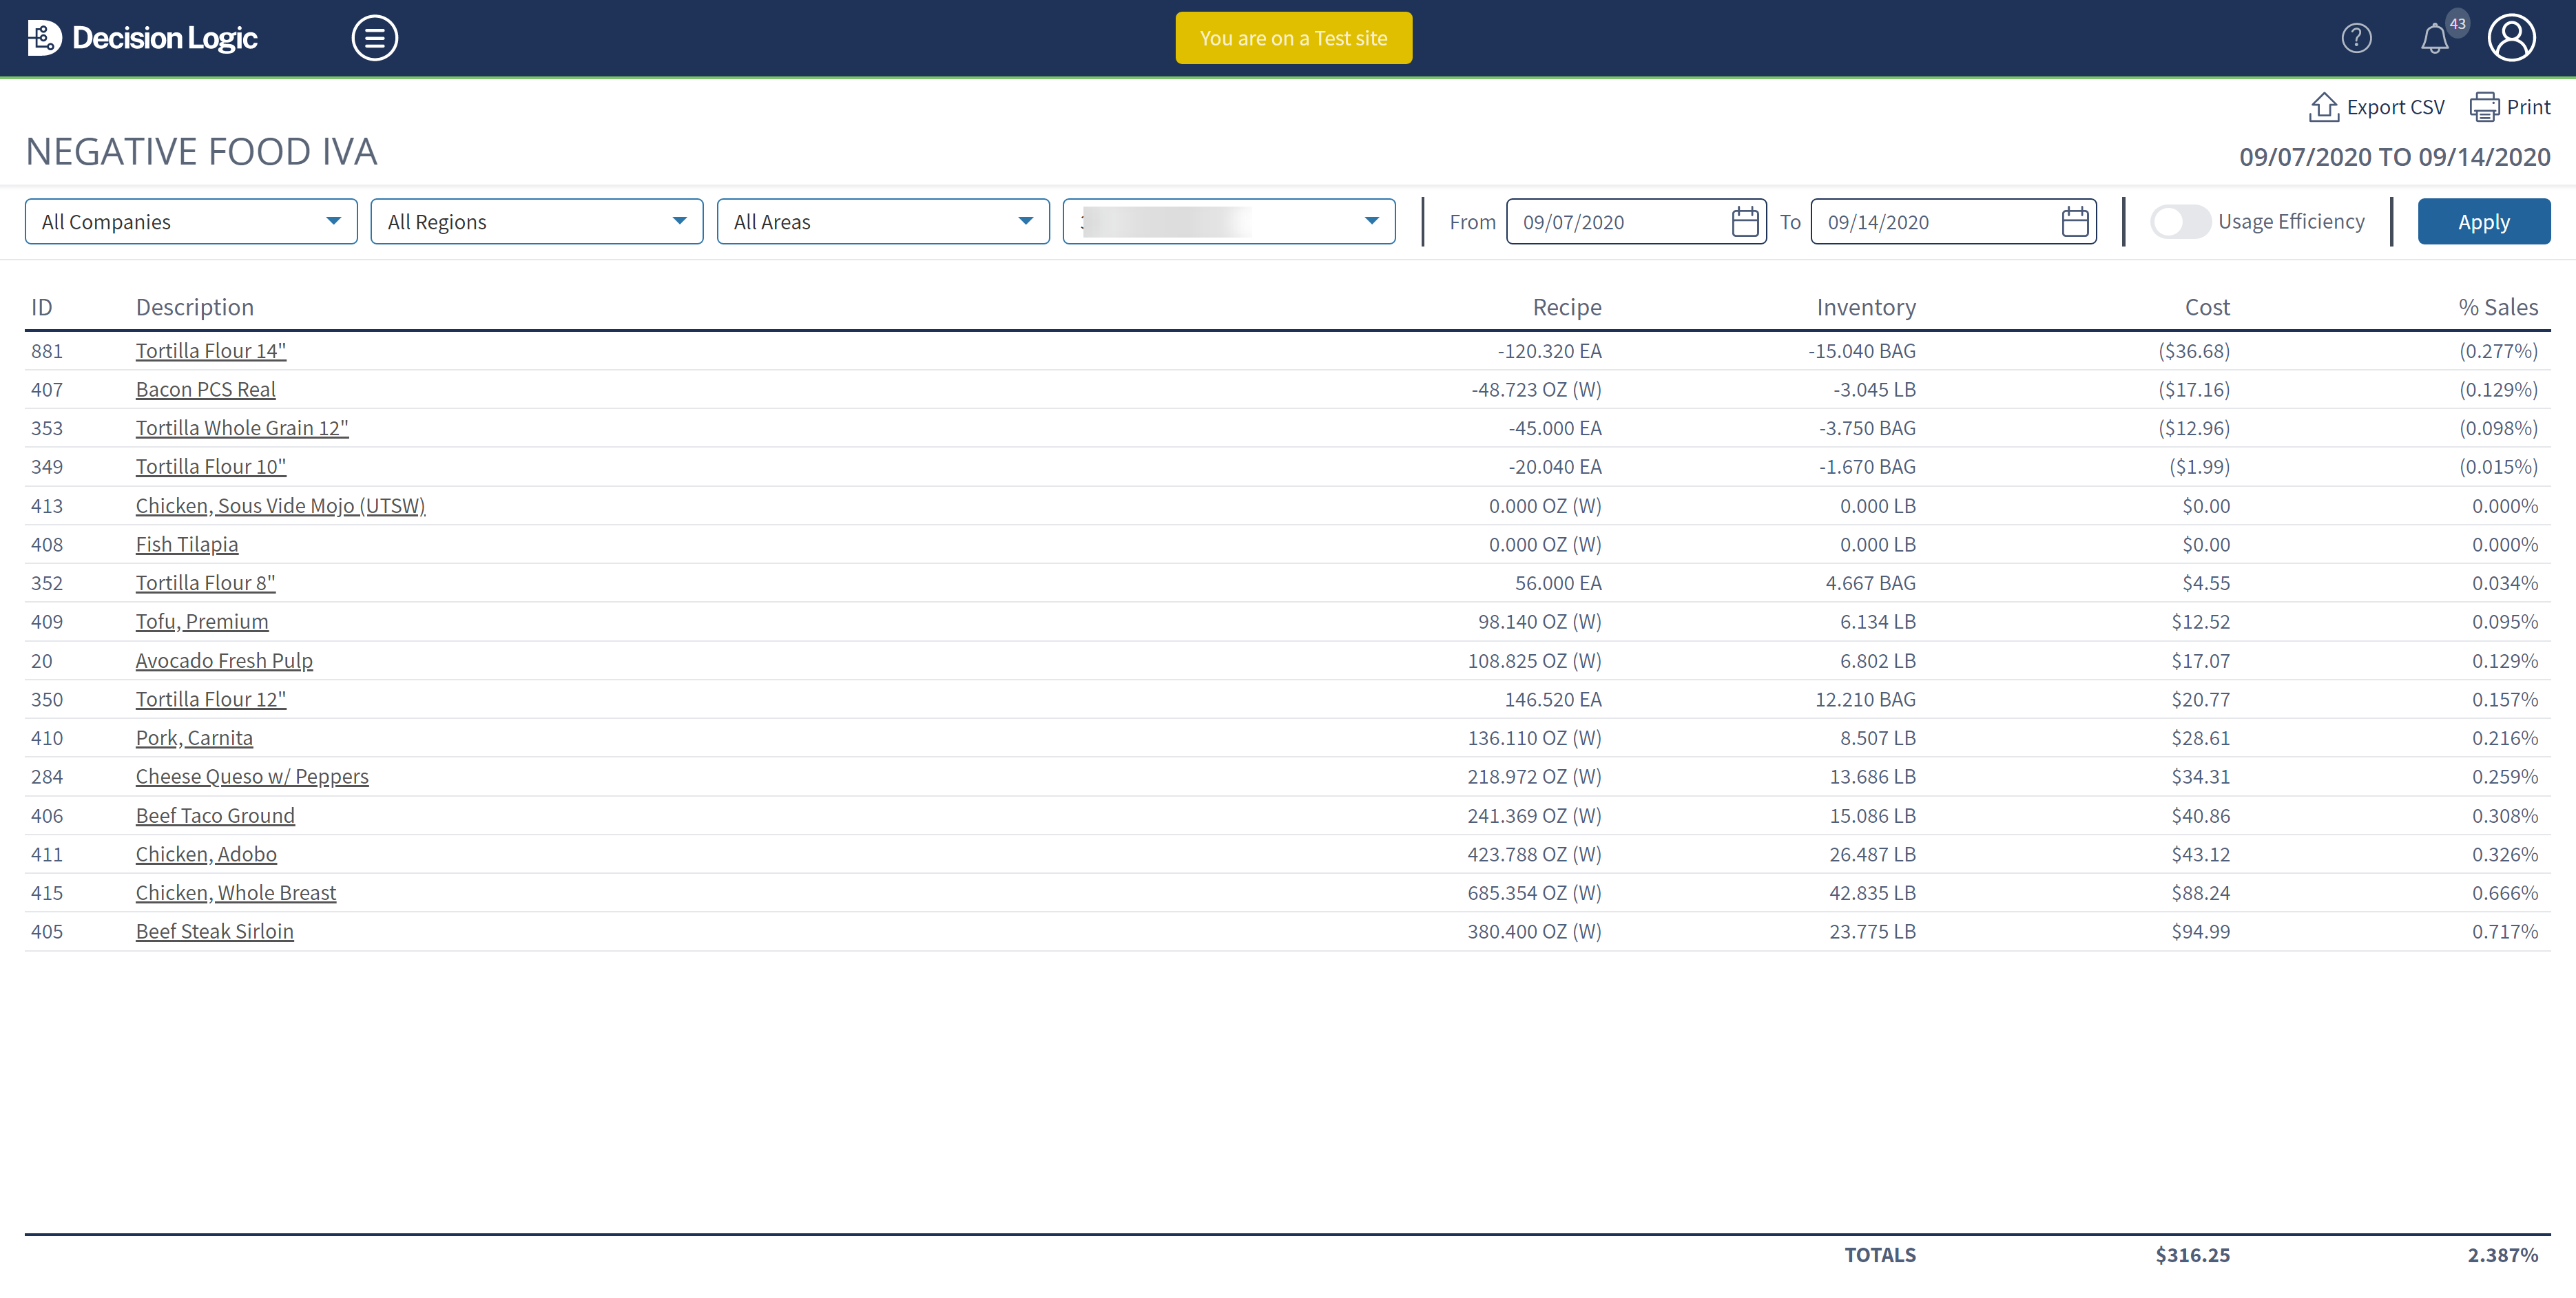
Select Usage Efficiency to view the Usage Efficiency bar on the Top 20 IvA report.
See Usage Efficiency

Select Export to CSV to export this report to a csv
Select Print to print or save as PDF
Calculations
Metric | Calculation |
|---|---|
IvA | |
Usage Efficiency | see Usage Efficiency |