This article details how a user can compare current sales to previous sales by date inside the Decision Logic web application (platform). This is an excellent tool for store managers and above-store managers alike.
Site Menu Navigation
Reports > Sales and Ranking > Current Sales by Date
Overview
The Current Sales by Date report offers side-by-side comparisons of current sales to last week and last year's sales. Additionally, it proves other insightful metrics involving:
Labor
Revenue Origins
Comps and Discounts
Cash Accountability
Guest and Transaction Expenditure
Features
Identifying trends across regions, areas, and stores
Sales forecasting acuity
Operations performance review
Trajectory analytics
![]() Current Sales by Date reporting is often referred to as Current Sales and History or CS&H
Current Sales by Date reporting is often referred to as Current Sales and History or CS&H


Table of Contents
| Table of Contents | ||
|---|---|---|
|
| Info |
|---|
For additional questions or assistance, please submit a support ticket by visiting the Decision Logic Service Center. |
Getting Started
The Current Sales & History (CS&H) allows the user to run the report either as Gross or Net sales and view data by date or period. Let’s check out the parameters available for CS&H reporting.
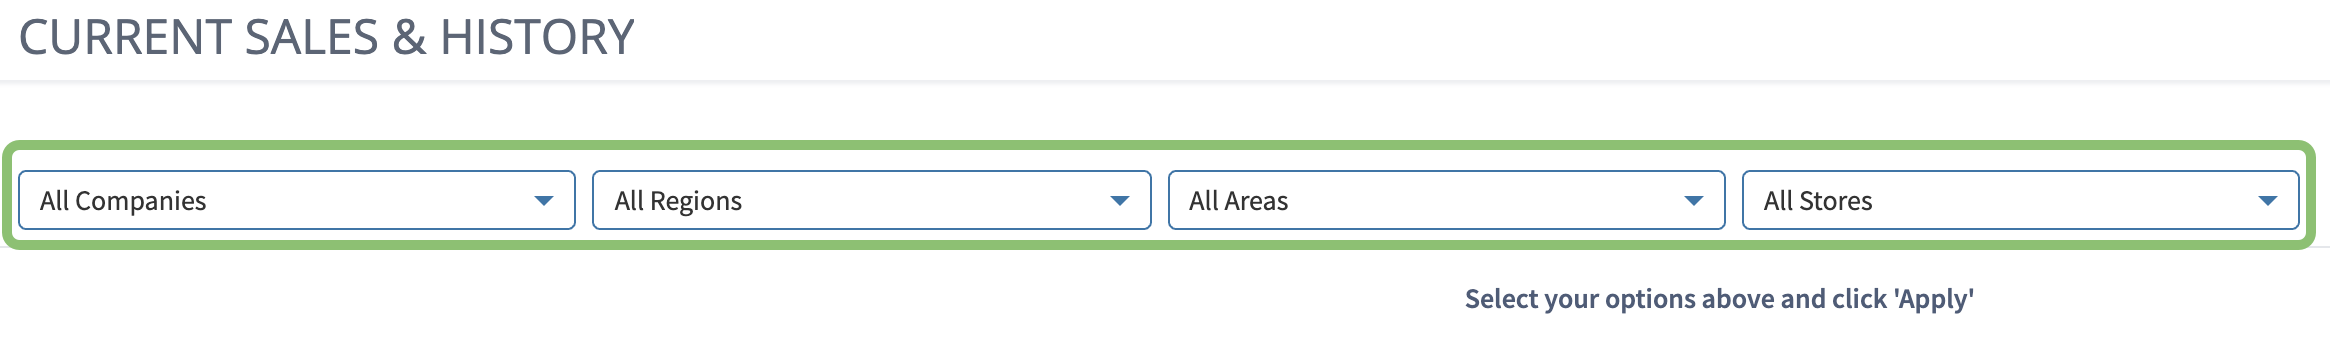
Select a Company, Region, Area, and Store (CRAS)
 Some menus may be greyed out if there is only one sub-hierarchal option available for the given selection or
  if the user viewing the report has a limited Profile Scope.
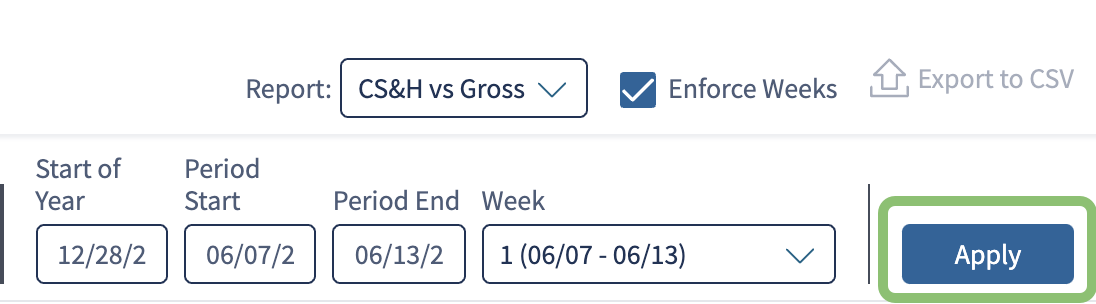
Check or uncheck the Enforce Weeks box.
Checking the box will enable Period Start, Period End, and Week which will only offer 7-day weeks. These are based on the weekday of the date entered in the Start of Year field.


Unchecking the box disables the weeks' enforcing and will give you a calendar to select the Range Start and Range End.


Once you have made your selections, click Apply. Each time you change your selections, you must click Apply for those changes to take place.

Year Comparison
The Year Comparison data only appears if you have checked Enforce Weeks. This section of the report gives a week-by-week comparison to the previous year. The section displays:
Current Year Sales and Guests
Last Year Sales and Guests
Sales and Guest Difference as a percentage

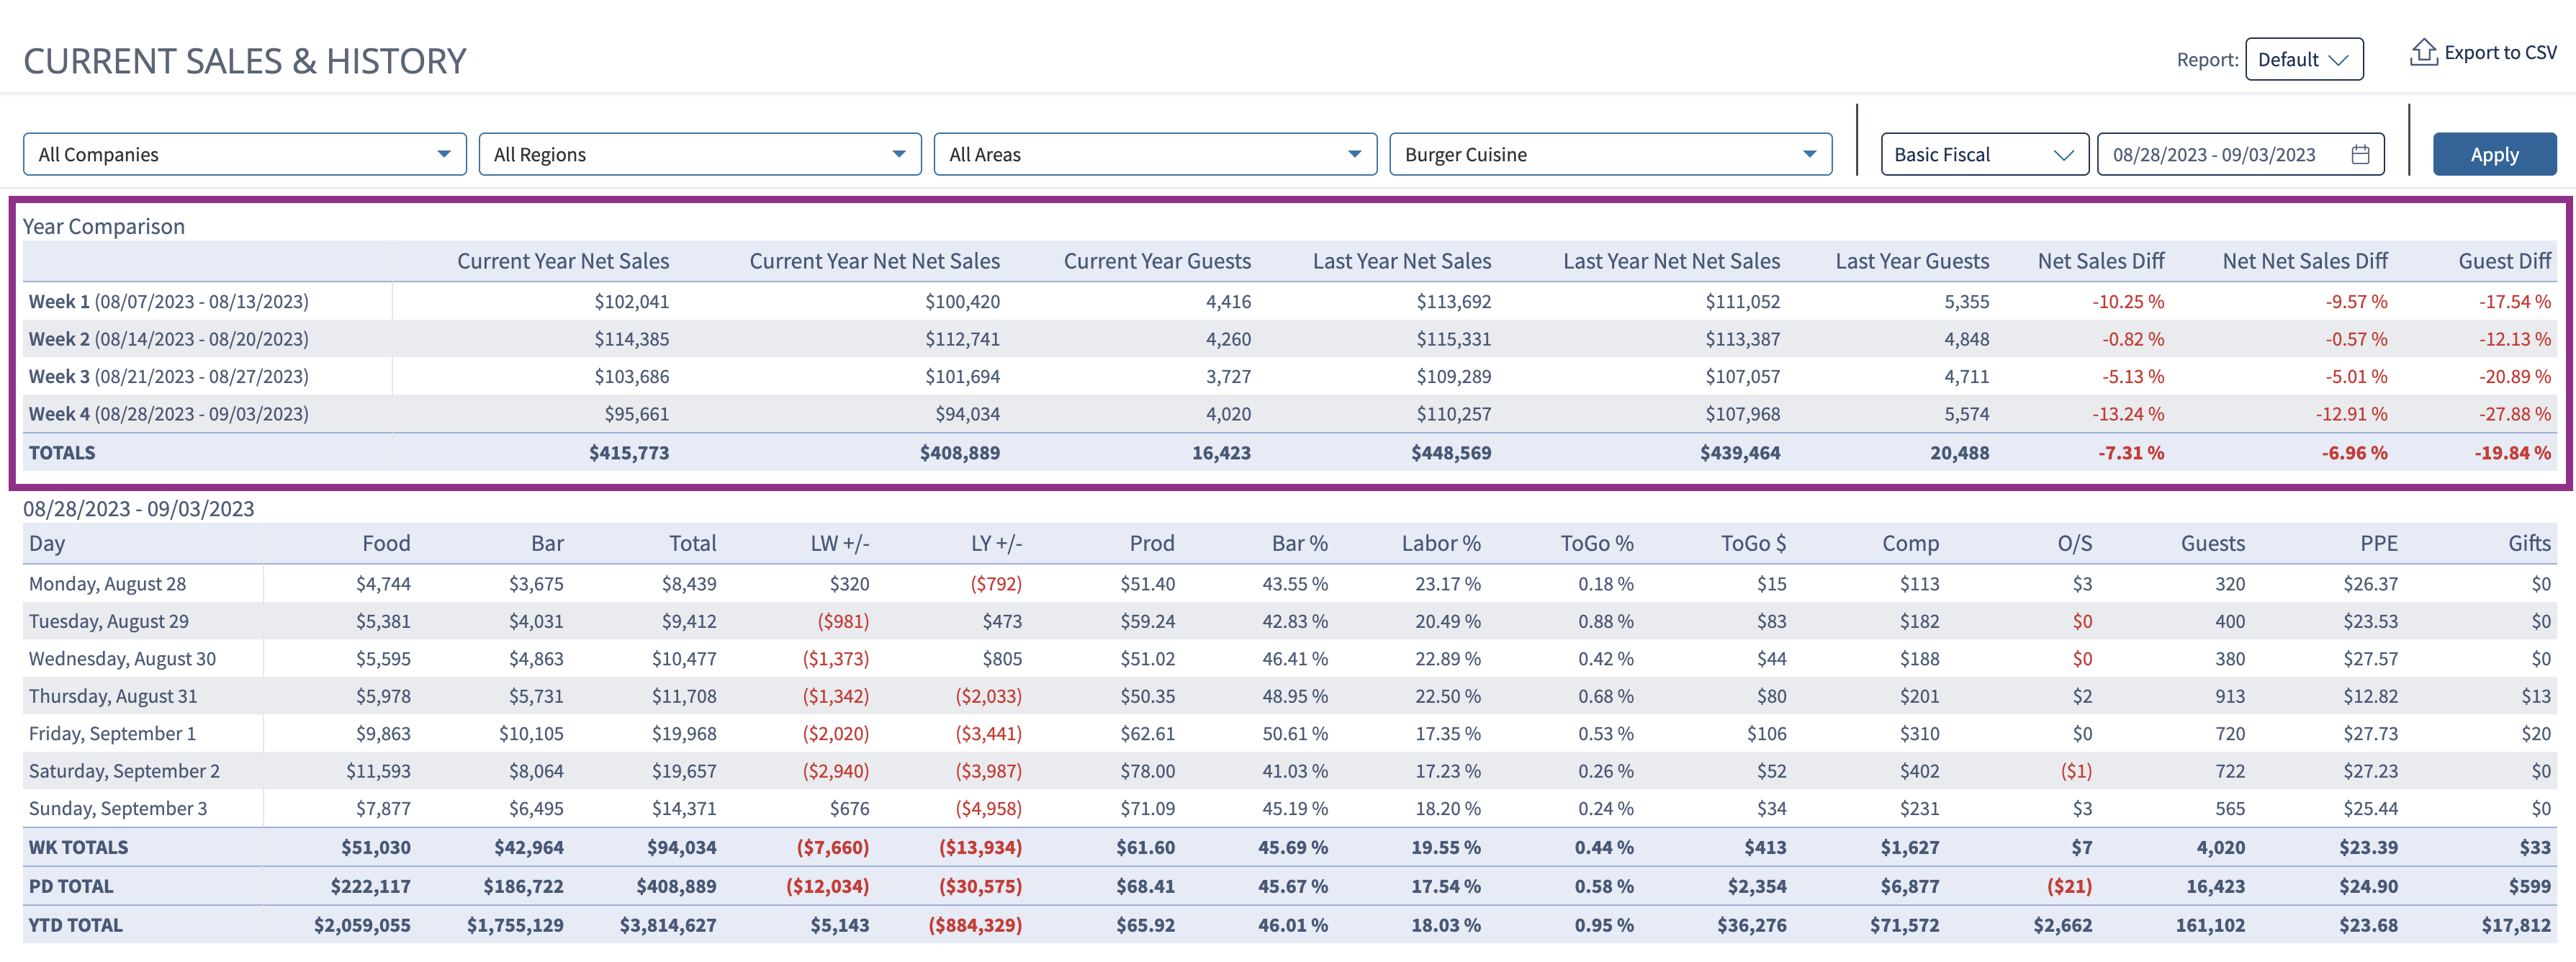
Current Sales & History by Day of Week
You can view the breakdown for the week or date range selected regardless of whether you enabled Enforce Weeks. If Enforce Weeks is disabled, the report will omit Year Comparison and instead provides all dates in the applicable range.


WK Totals (Week) are the aggregate of what is actively being displayed in the report.
PD Total and YTD Total (Period and Year-to-Date) are the aggregates of the entire date ranges up to the last date being displayed.
![]() Day-of-Week comparison dates for last year are generated by using the calendar date minus 364 days. For example:
Day-of-Week comparison dates for last year are generated by using the calendar date minus 364 days. For example:
Monday 8/3/2020 minus 364 days = Monday 8/5/20202019
Current Sales and History Rollup
This is the last section that shows the same metrics as the middle section and the applicable totals in a hierarchical breakdown per Company, Region, Area, and Store.
![]() The Rollup section only renders when a Company, Area, or Region is selected and not when an individual store is selected. The section is titled by the highest level selected.
The Rollup section only renders when a Company, Area, or Region is selected and not when an individual store is selected. The section is titled by the highest level selected.
Company is listed at the bottom, with Regions, Areas, and Stores rolled up above. Each hierarchical level is given an indentation to differentiate them, starting with the level selected. When the report is narrowed to contain only one sub-level, the indentations will no longer appear.


![]() Clicking on a row will narrow all of the reporting displayed on the page to the chosen selection.
Clicking on a row will narrow all of the reporting displayed on the page to the chosen selection.