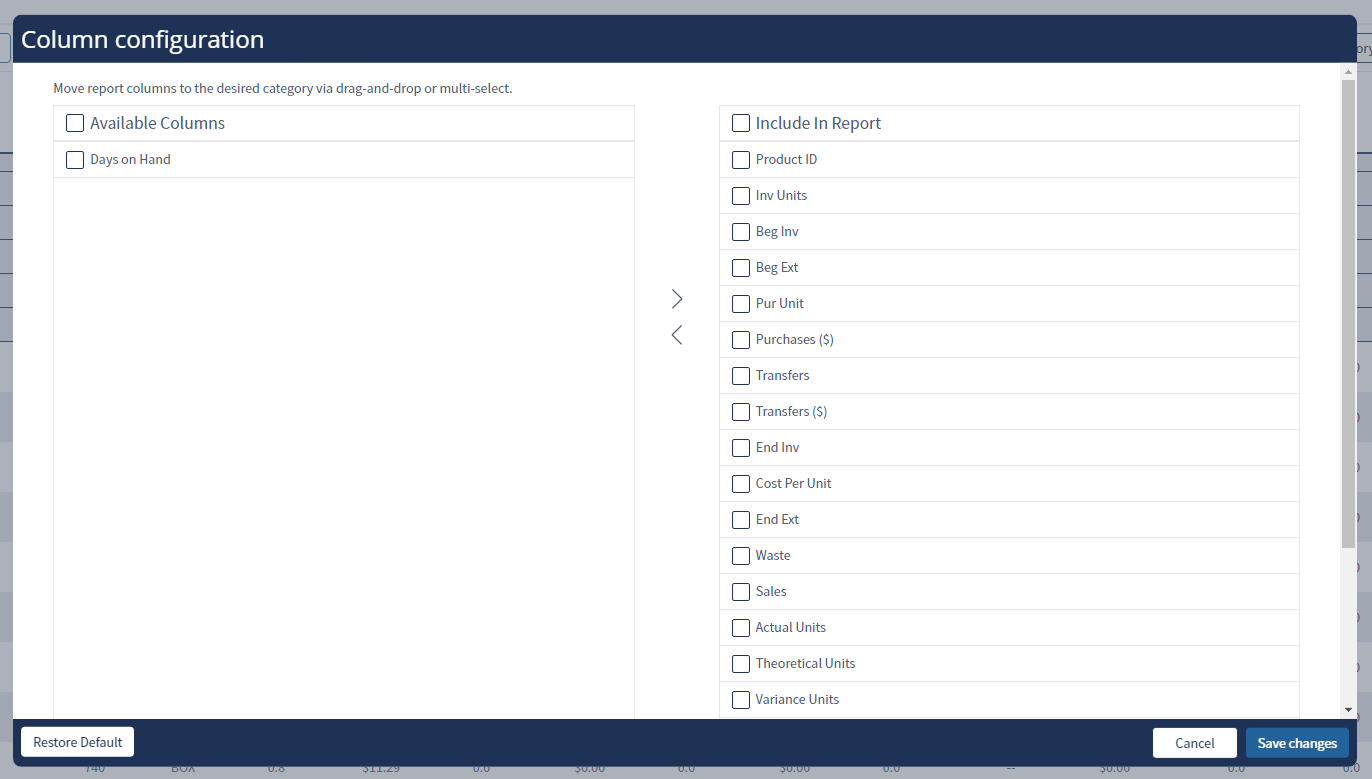
Column Configuration
The report can be configured to show columns that mean the most to you.
For example, if you primarily work with dollar values, you can exclude the columns that show inventory units.
If you would like to see a certain set of columns:
Select the Configure Report button in the upper-right corner of the page.
By default, all columns are selected to be included in the report.
Move any columns you don’t want to see into the Available Columns section.
Do this by dragging and dropping the names in the list or selecting the checkbox and using the < arrow button.
At least one column is required to run the report.
Reorder the columns in the Include In Report section to show them in the order that you want.
Do this by dragging and dropping the names in the list.
The first column on the list will be shown in the left-most position on the report.
If you want to revert the page to its default settings, select the Restore Default button.
The page settings are set by the web browser that you are using.
If you share the browser with other Decision Logic users, the column sorting you select will affect them.
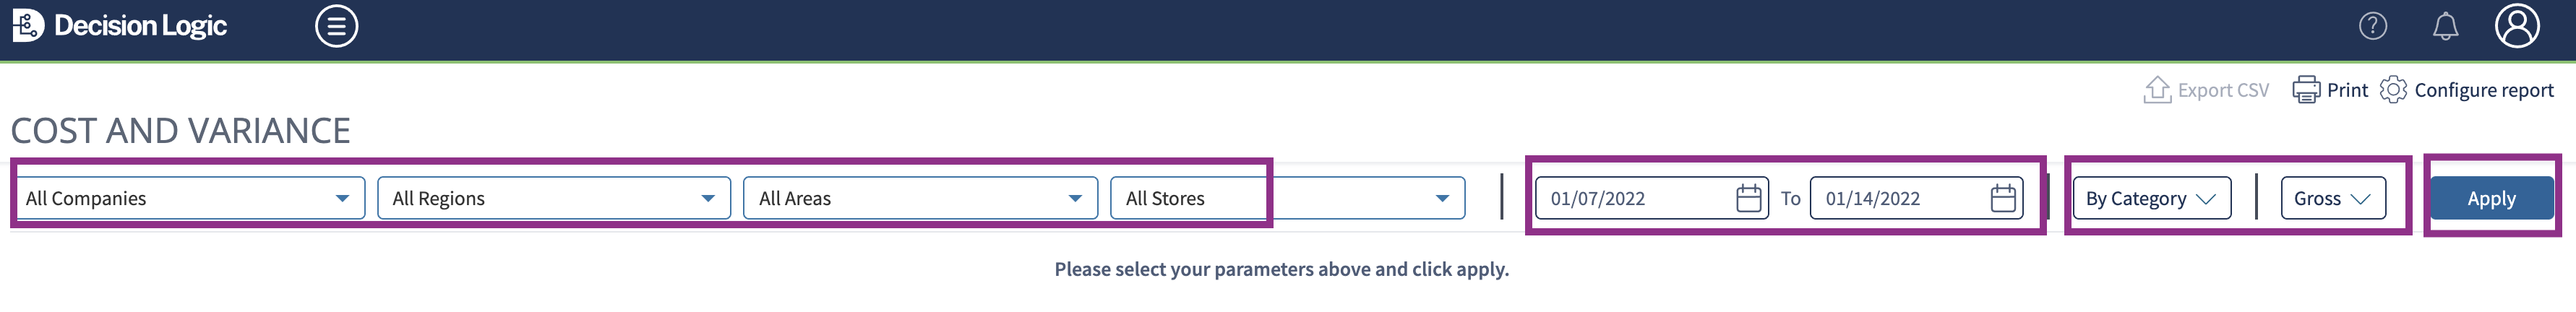
Select Parameters
Define your Company, Region, Area, or Store.
Store level users will only see their store and will not be able to select other stores.
Select From and To dates from the calendars.
Choose From and To dates that correspond to your inventory calendar.
The page defaults to the current date and current date minus 7 days.
Use the date of the inventory.
For example, select both Mondays if inventories are taken weekly on Mondays.
Choose to view the report By Category or By Product.
Select Gross or Net as the devisor to use as the % of Sale.
Select Apply.
All metrics will be displayed in the order they are configured in the Configure Report settings.
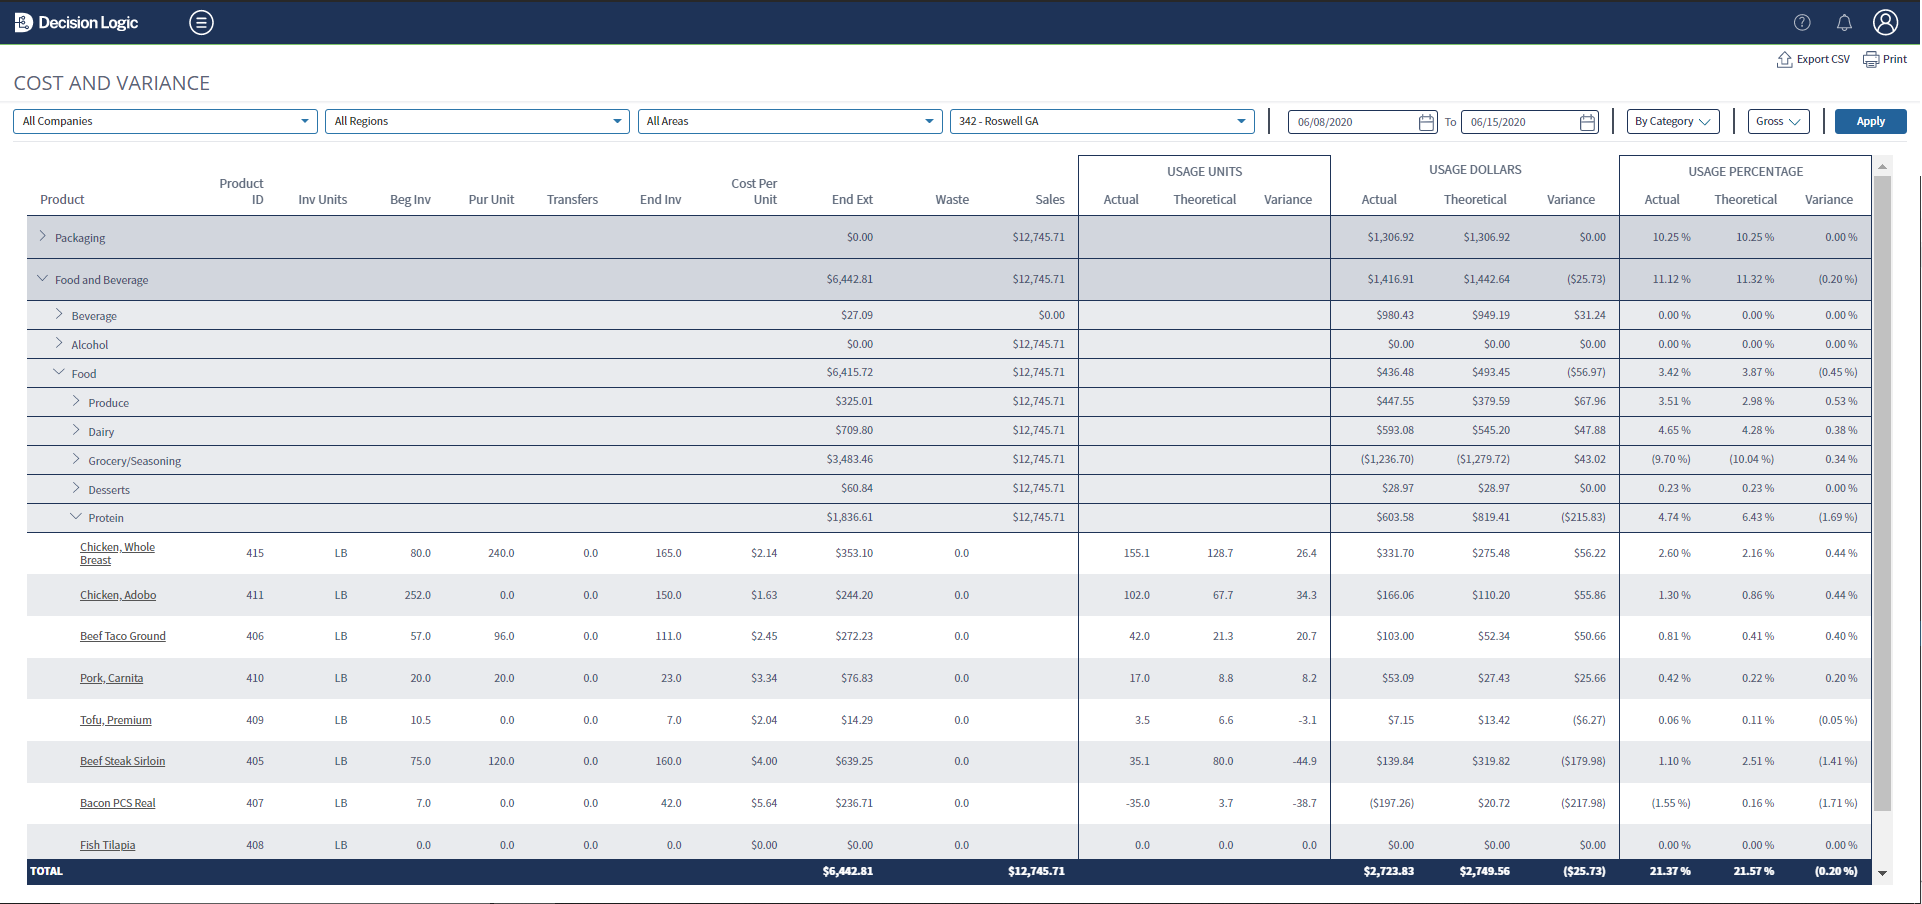
By Category, By Product, vs. By Store
Regardless of which view is selected, the report will sort the products descending from the largest variance (loss) to the largest negative variance (growth) as a percentage of sales.
By Category will display the categories rolled up with totals where applicable.
You can drill down into each category down to the product level.
This report style is used to look at usage and variance from “top-down” to identify where there is the most room for improvement per category.

By Product will display all products at once. Since they are organized by variance as a percentage of sales, this report style is used to identify which products have the most room for improvement regardless of category.

By Store will display each store’s breakdown and provides a ranking per category. When users filter through different data, the ranking will update per category.
Ranking is determined by Usage Percentage Variance by default. If a user clicks any other filter in the header of the columns, the rank will be adjusted. When a store does not have data for the column that is being filtered, it will list stores alphabetically and the top store will be ranked as #1.

Definitions & Calculations
Column Metrics
Product and Product ID- Also referred to as Ingredients, are established in the Ingredient Management.
Inv Units - Inventory Measure, also established in Ingredient Management.
Beg Inv and End Inv - Inventoried quantity of inventory measure taken on the selected dates.
Beg Ext and End Ext - The dollar value of the inventory taken on the selected dates.
End Ext is also known as the Shelf Extension value, calculated as End Inv x Cost per Unit.
Pur Unit - Quantity of Inventory Measure received on orders in the Inventory Periods selected.
Purchases ($) - The dollar value of purchases received on orders selected in the inventory period.
Transfers IUT - Inter-Unit Transfers (IUTs).
Transfers IUT ($) - The dollar value of Inter-Unit Transfers (IUTs).
Cost per Unit - Dollar value per Inventory Measure. The price is determined using the Accounting Method for the Category, established in COGS Maintenance.
Usage - Usage metrics are reported in Quantity, $, and %.
Actual Usage = Beg Inv + Pur Unit + Transfers - End Inv.
Theoretical Usage = Menu Mix x Recipe Quantity.
Usage Variance = Actual Usage - Theoretical Usage.
Waste - Quantity entered in Waste Sheets.
Days on Hand - This metric estimates the number of days of usage before your inventory will be depleted so that you can view if you have too much or too little product. It is calculated using your actual usage with this formula for each item: Ending Inventory Quantity / (Actual Usage Inventory Quantity / Days in Inventory Week).
Low values of on-hand ingredients can lead to smaller variances, as staff will use the product more conservatively. A good rule of thumb is to have enough product on hand to reach your next distributor delivery.
If you see a negative value in this column, see Investigating Product Growth for tips on how to know why this may be happening.
Null -- Values
Any value in a column displayed as a double-dash “--” is referred to as null, which means that the data is not available.
Below are some examples of where this might be seen and why the value is null:
Beginning / Ending Inventory - The ingredient was not on an Inventory Set that the store was assigned to at the time of Inventory.
Days on Hand - The ingredient is missing an Ending Inventory quantity, and the calculation cannot be completed.
Product “Non-Inventoried Items” - Distributor Items assigned to a COGS Category but not an Ingredient.
The Purchase values are used as the Actual and Theoretical values since they cannot be inventoried.
TvA Reporting will itemize these if more information is needed on what was purchased.
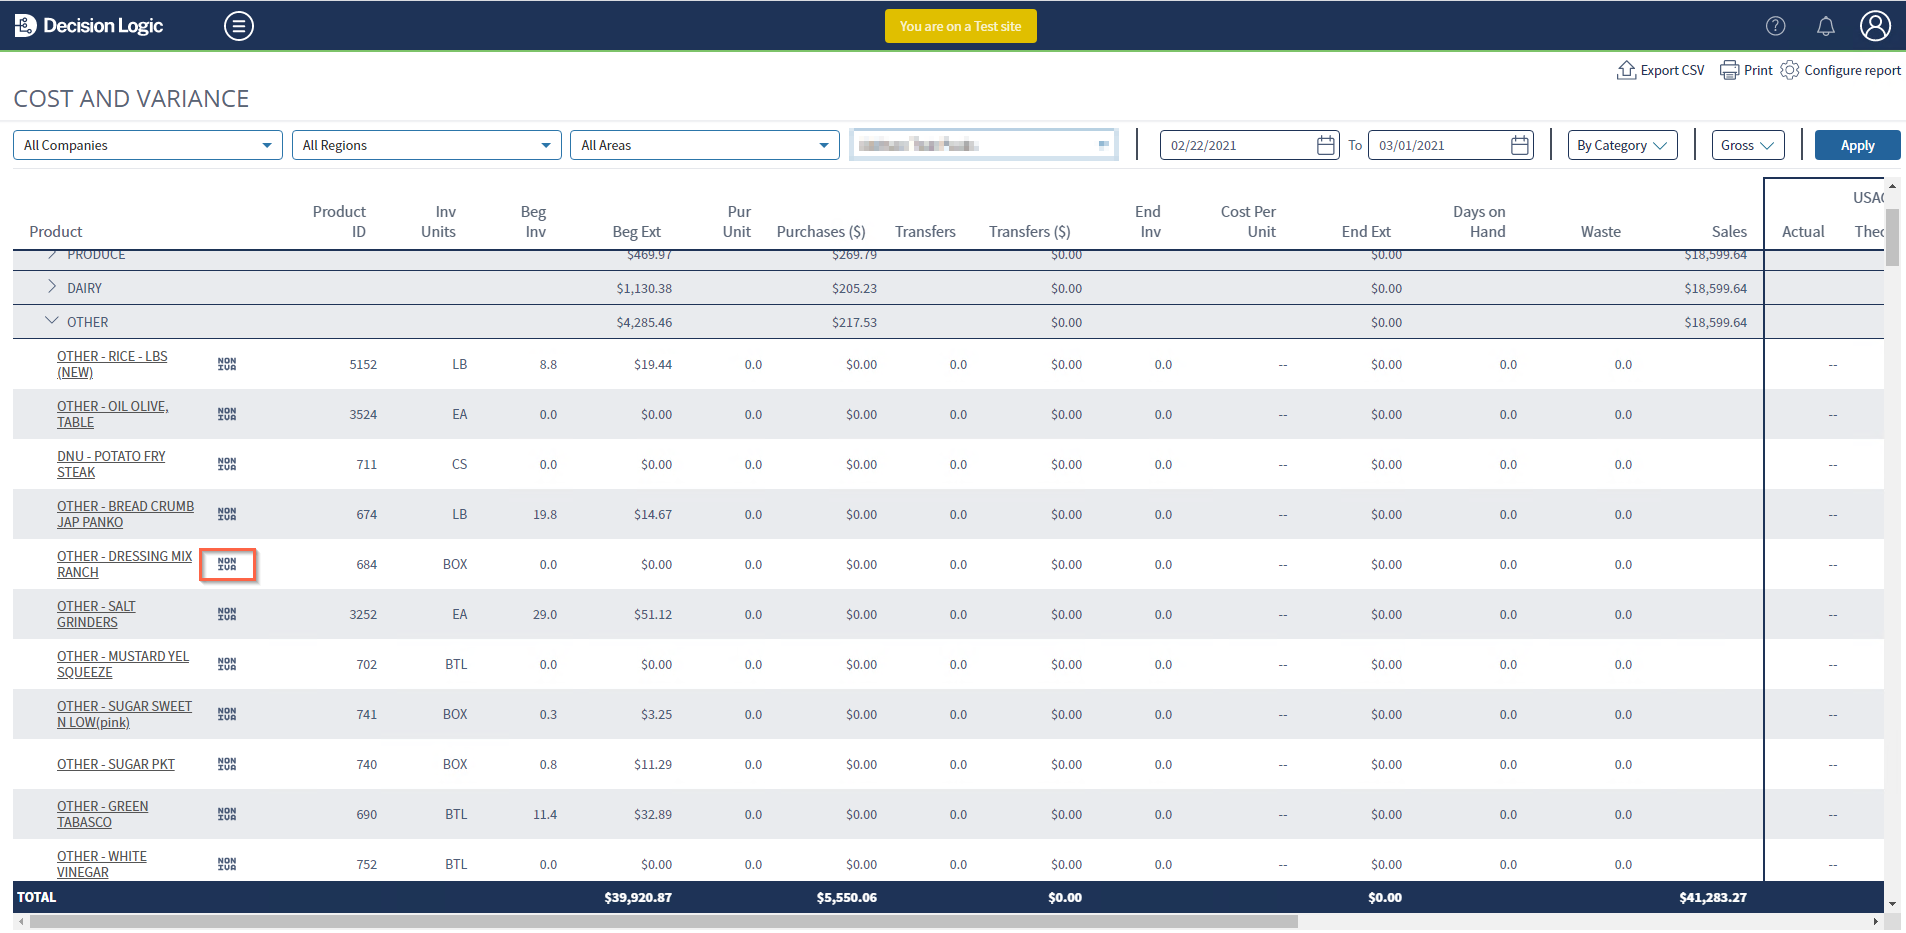
Non-IvA Items
Theoretical values of Non-IvA Items will be overwritten using Actual Usage values.
Non-IvA items include:
Ingredients that are not used in Menu Item Recipes.
Ingredients that are not marked for IvA with the checkbox in Ingredient Management.
Items are noted as Non-IvA using the icon shown below:

Product Details
Selecting an individual product will take you to the Product Details page.

For more information, please review the IvA Ingredient Details article.
Export CSV & Print
These functions can be found at the top right corner of the page.
When exporting in. CSV format, all products, and metrics used in the report will be included using the selected store(s), date range, and sales parameters.
Export with By Category selected will include the COGS Sections and COGS Account Categories in the first columns, whereas By Product will not.
The configuration selected on the Configure Report screen will be ignored when exporting and printing.
The printing function can print a physical copy of the report or save the report as a PDF or other file type. Only the products actively displayed and metrics in the report will save/print when used.
For example:
- if By Product is selected, all products will be included.
- if By Category is selected, only COGS Sections, COGS Account Categories, and products actively displayed in drill-downs will be included.
Additionally, the print function can accommodate 16-17 columns, and each field can have a value of up to 1000000 without overlapping with the next column. Adjusting the printing settings can allow for more columns to be printed. Examples of settings that can be changed to allow this are Scale, Layout, Margins, and Paper Size.
| Info |
|---|
Unable to access this page in Decision Logic?
|