Ideal vs. Actual usage is recommended for use by restaurant managers as it focuses on quantity wasted, not the dollar amount of waste.
For example, instead of "$50 of wasted chicken wings," IvA displays a quantity of 60 wings wasted.
What | Formula |
|---|---|
Ideal vs Actual (IvA) | Ideal vs Actual is the amount actually used compared to the ideal amount used. This is found by using the following formula:
|
Ideal Usage | Ideal usage, or the quantity used if 0 product was wasted, is calculated directly from product mix reporting pulled from the POS System. |
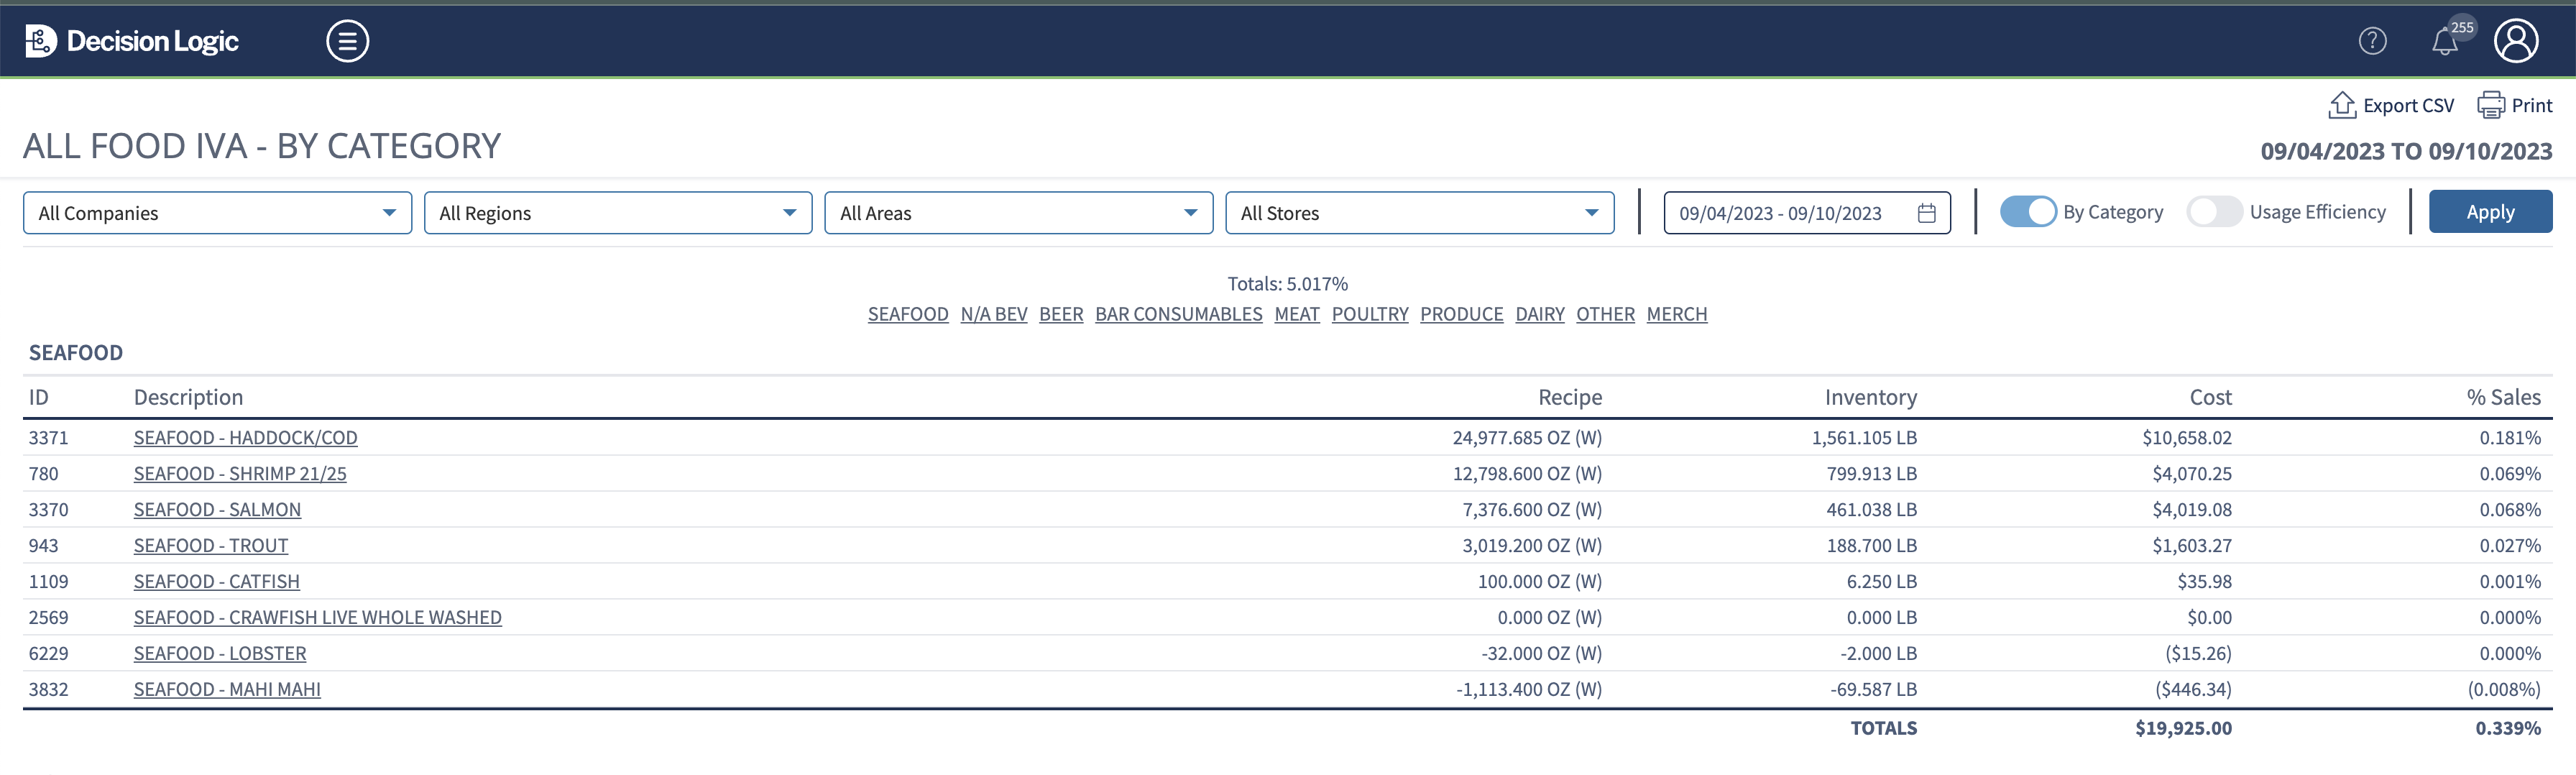
All Food IvA
All Food IvA displays the variance of every food item set up in Decision Logic and selected for the IvA Report. It organizes products by category and by highest variance based on cost value within the categories.
Navigate to Reports> Reports > Cost and Variance> Variance > All Food IvA
![]() These These reports are printable. Users can also export to CSV.
These These reports are printable. Users can also export to CSV.

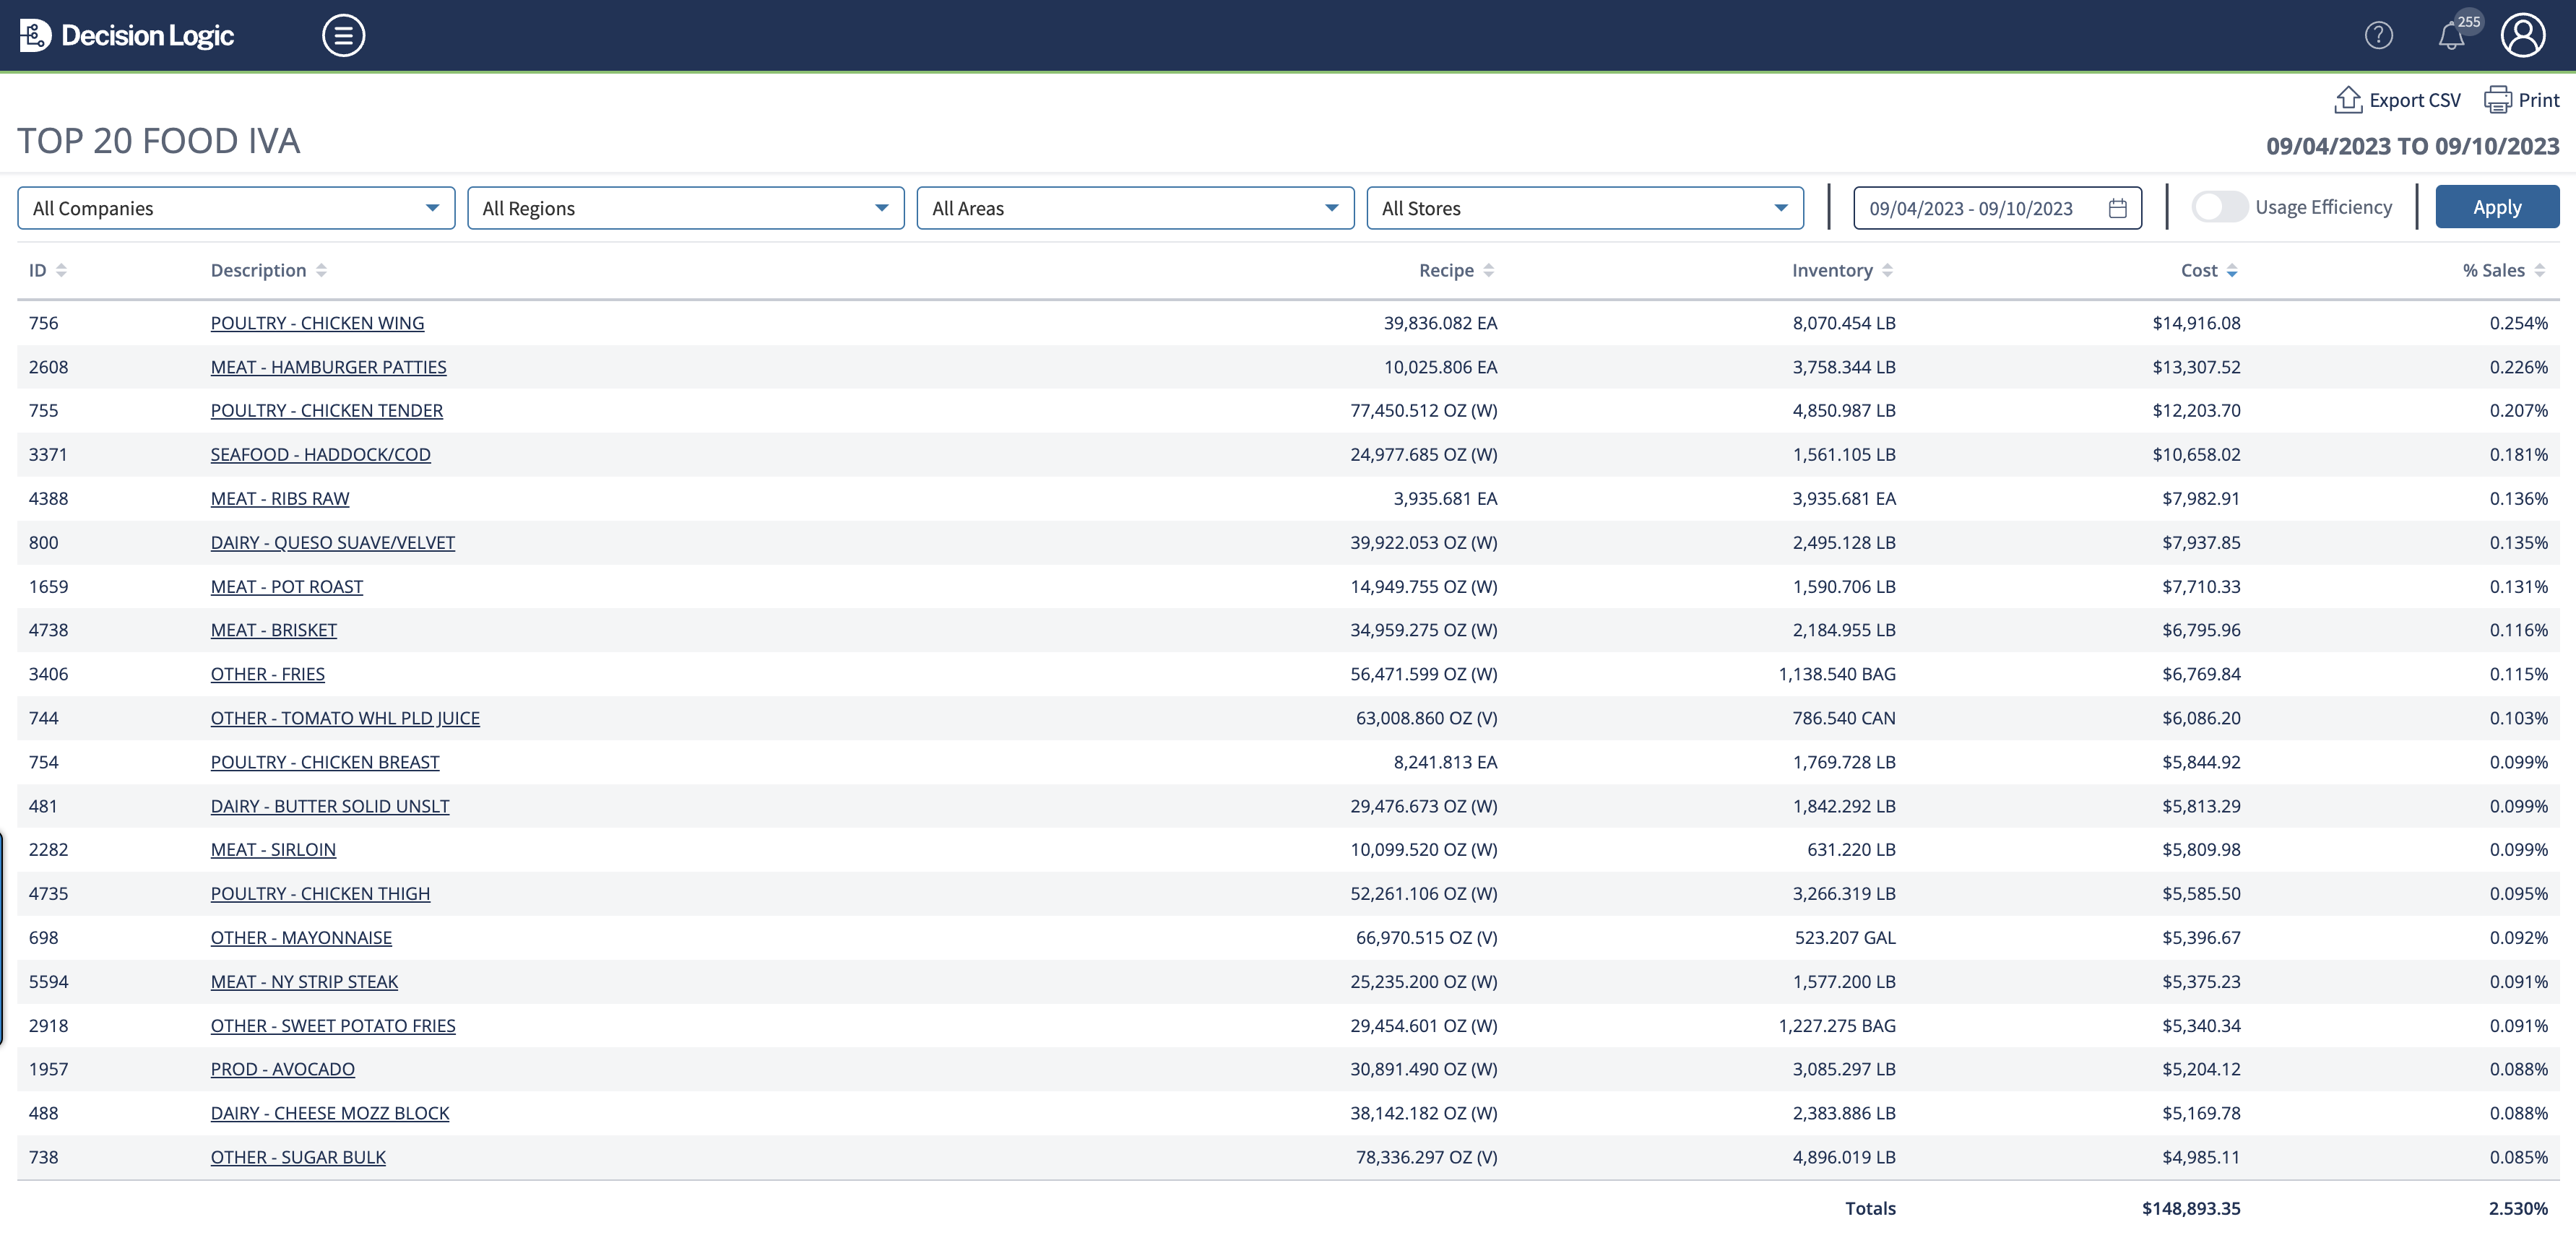
Top 20 Food IvA
Top 20 Food IvA shows the 20 food products with the highest Ideal vs. Actual variance based on cost value of variance and likely need attention.![]() These
These
Navigate to Reports > Cost and Variance > Top 20 Food IvA
These reports are printable. Users can also export to CSV.

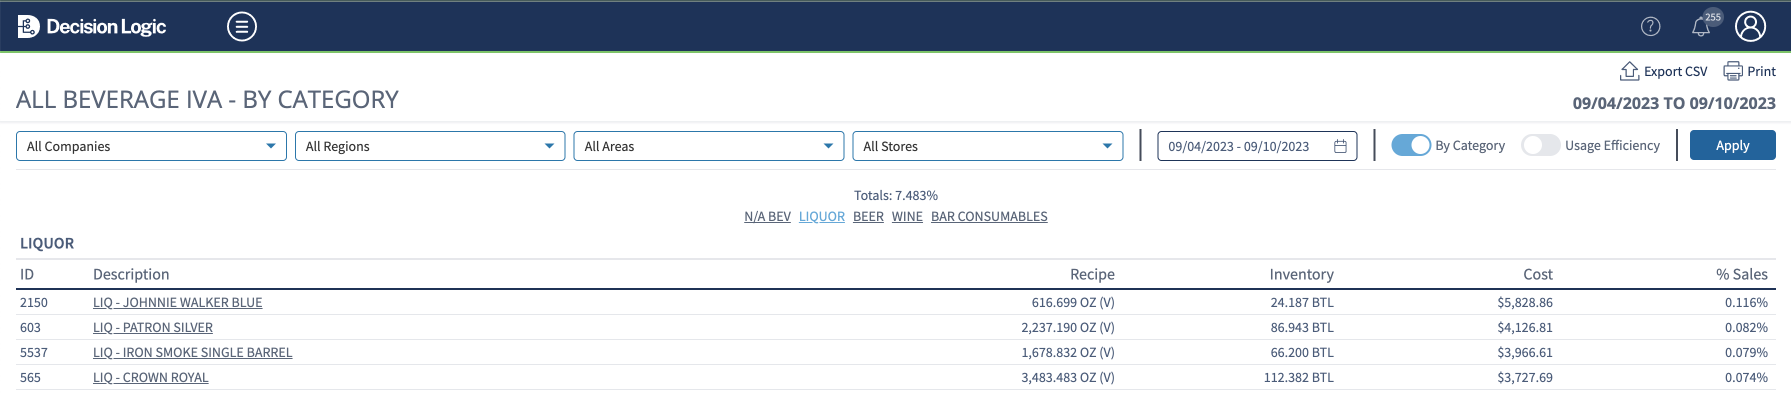
Beverage IvA
Beverage IvA displays the variance of every item that is set up as a beverage in Decision Logic. This This is managed in Ingredient Management.
![]() Navigate to Reports > Cost and Variance > Beverage IvA
Navigate to Reports > Cost and Variance > Beverage IvA
These reports are printable. Users can also export to CSV.

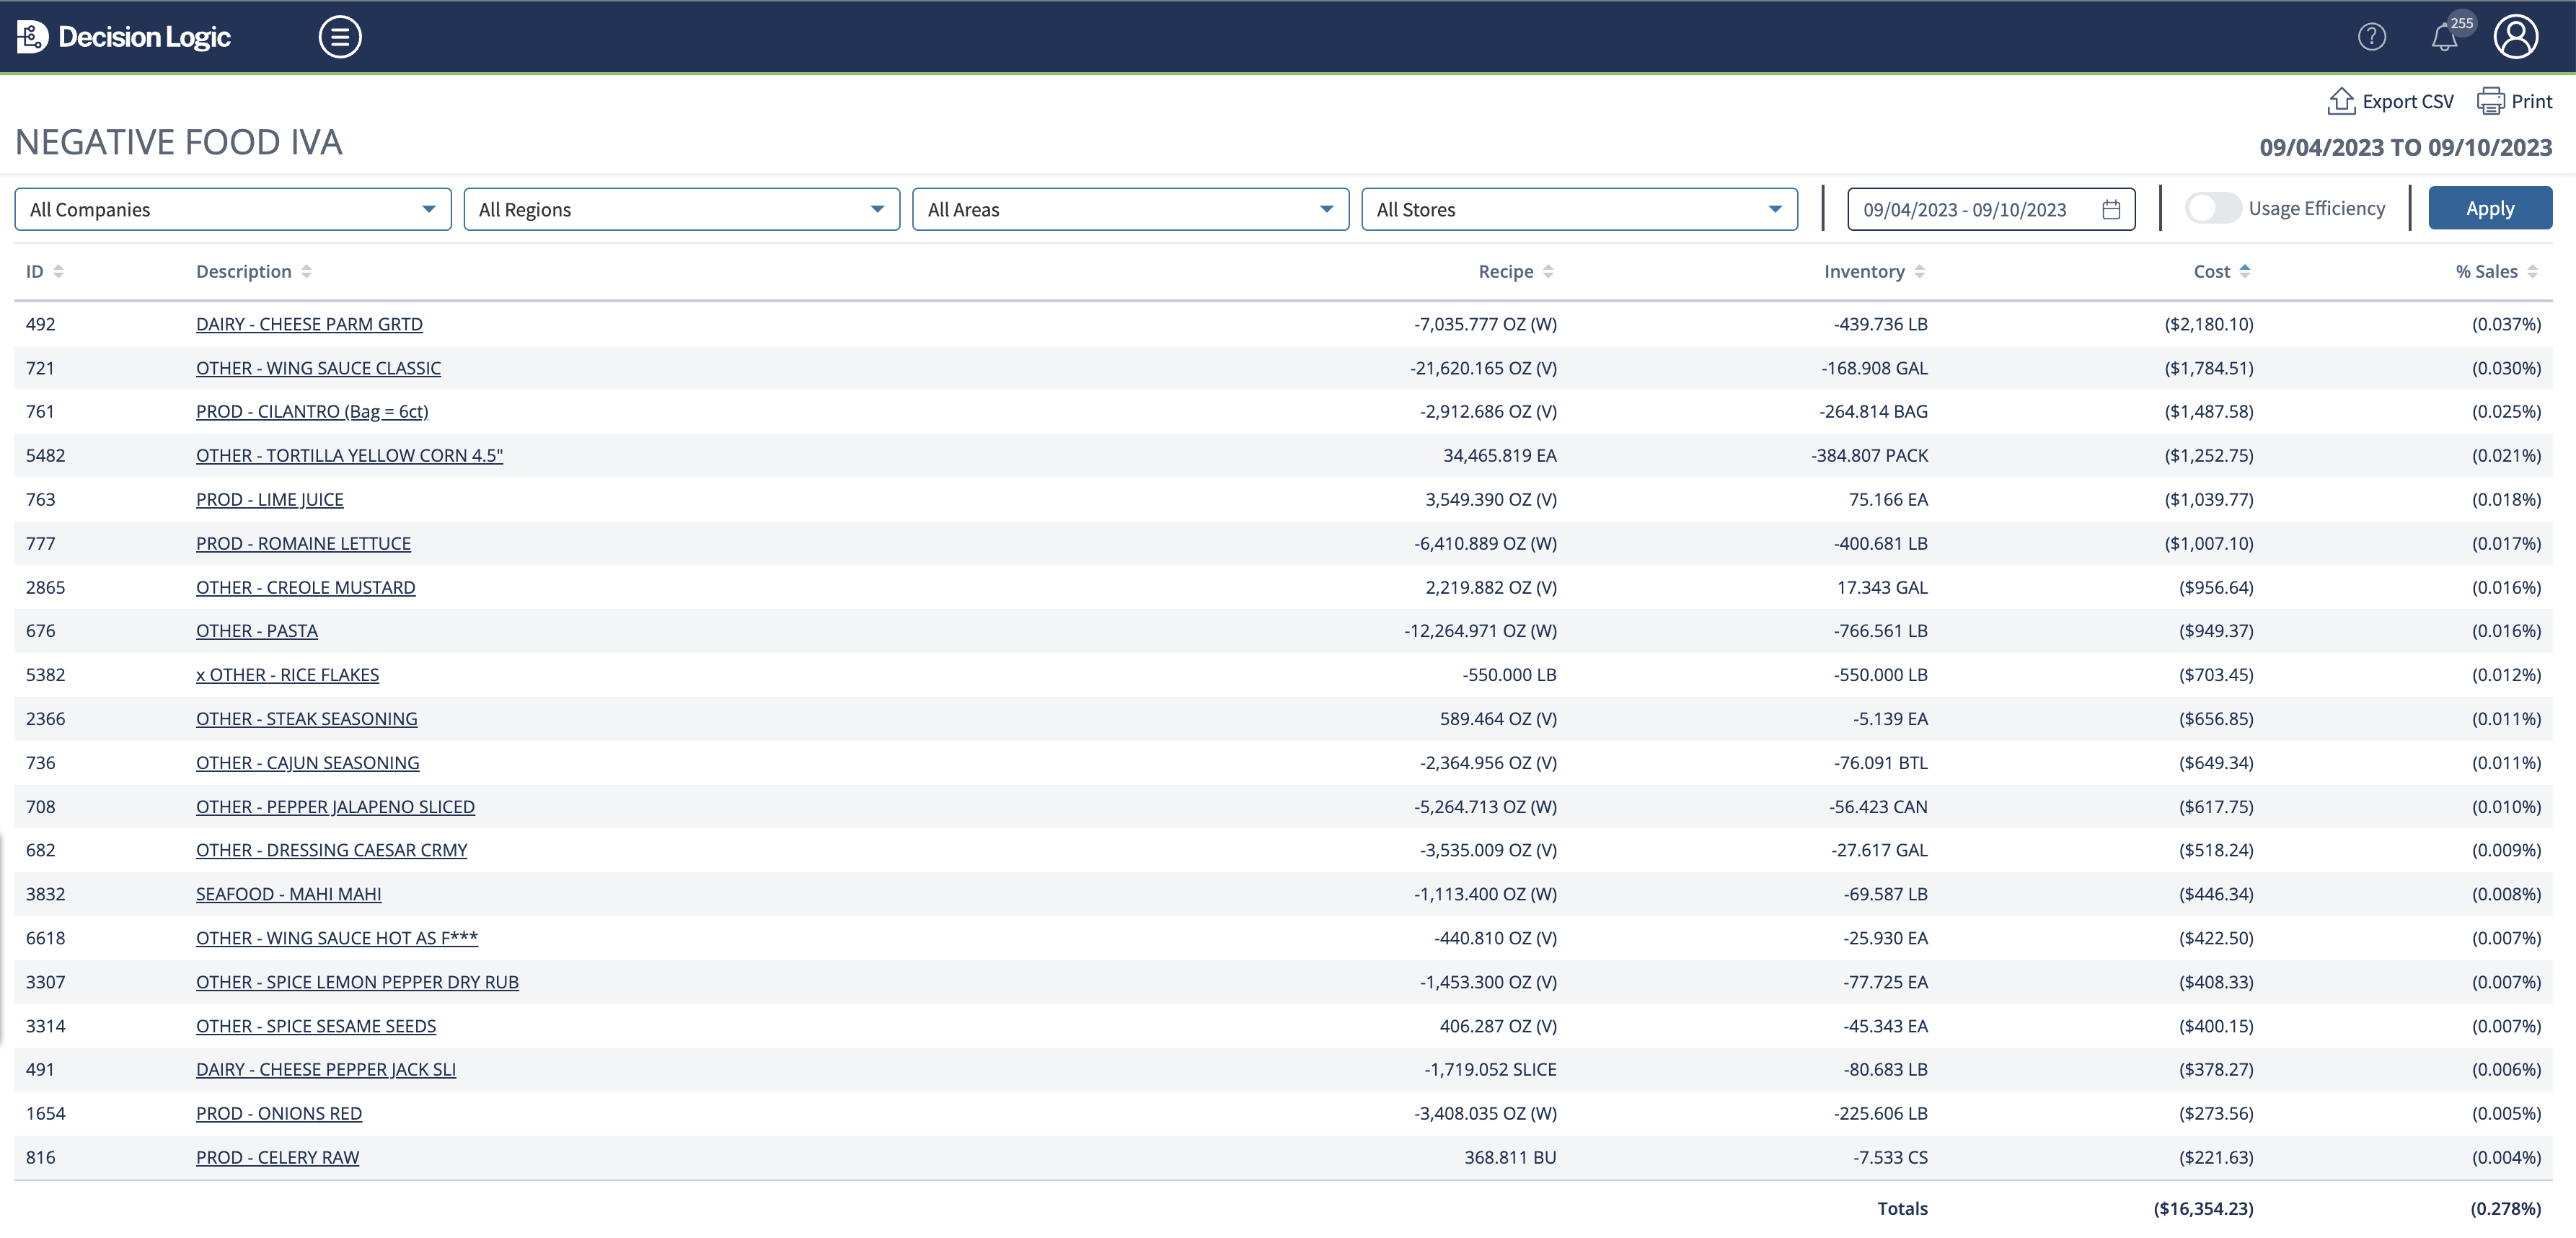
Negative Food IvA
Negative Food IvA allows the manager to see the 20 highest negative usage products in order by cost value of variance. ![]()
Navigate to Reports > Cost and Variance > Negative Food IvA
These reports are printable. Users can also export to CSV.

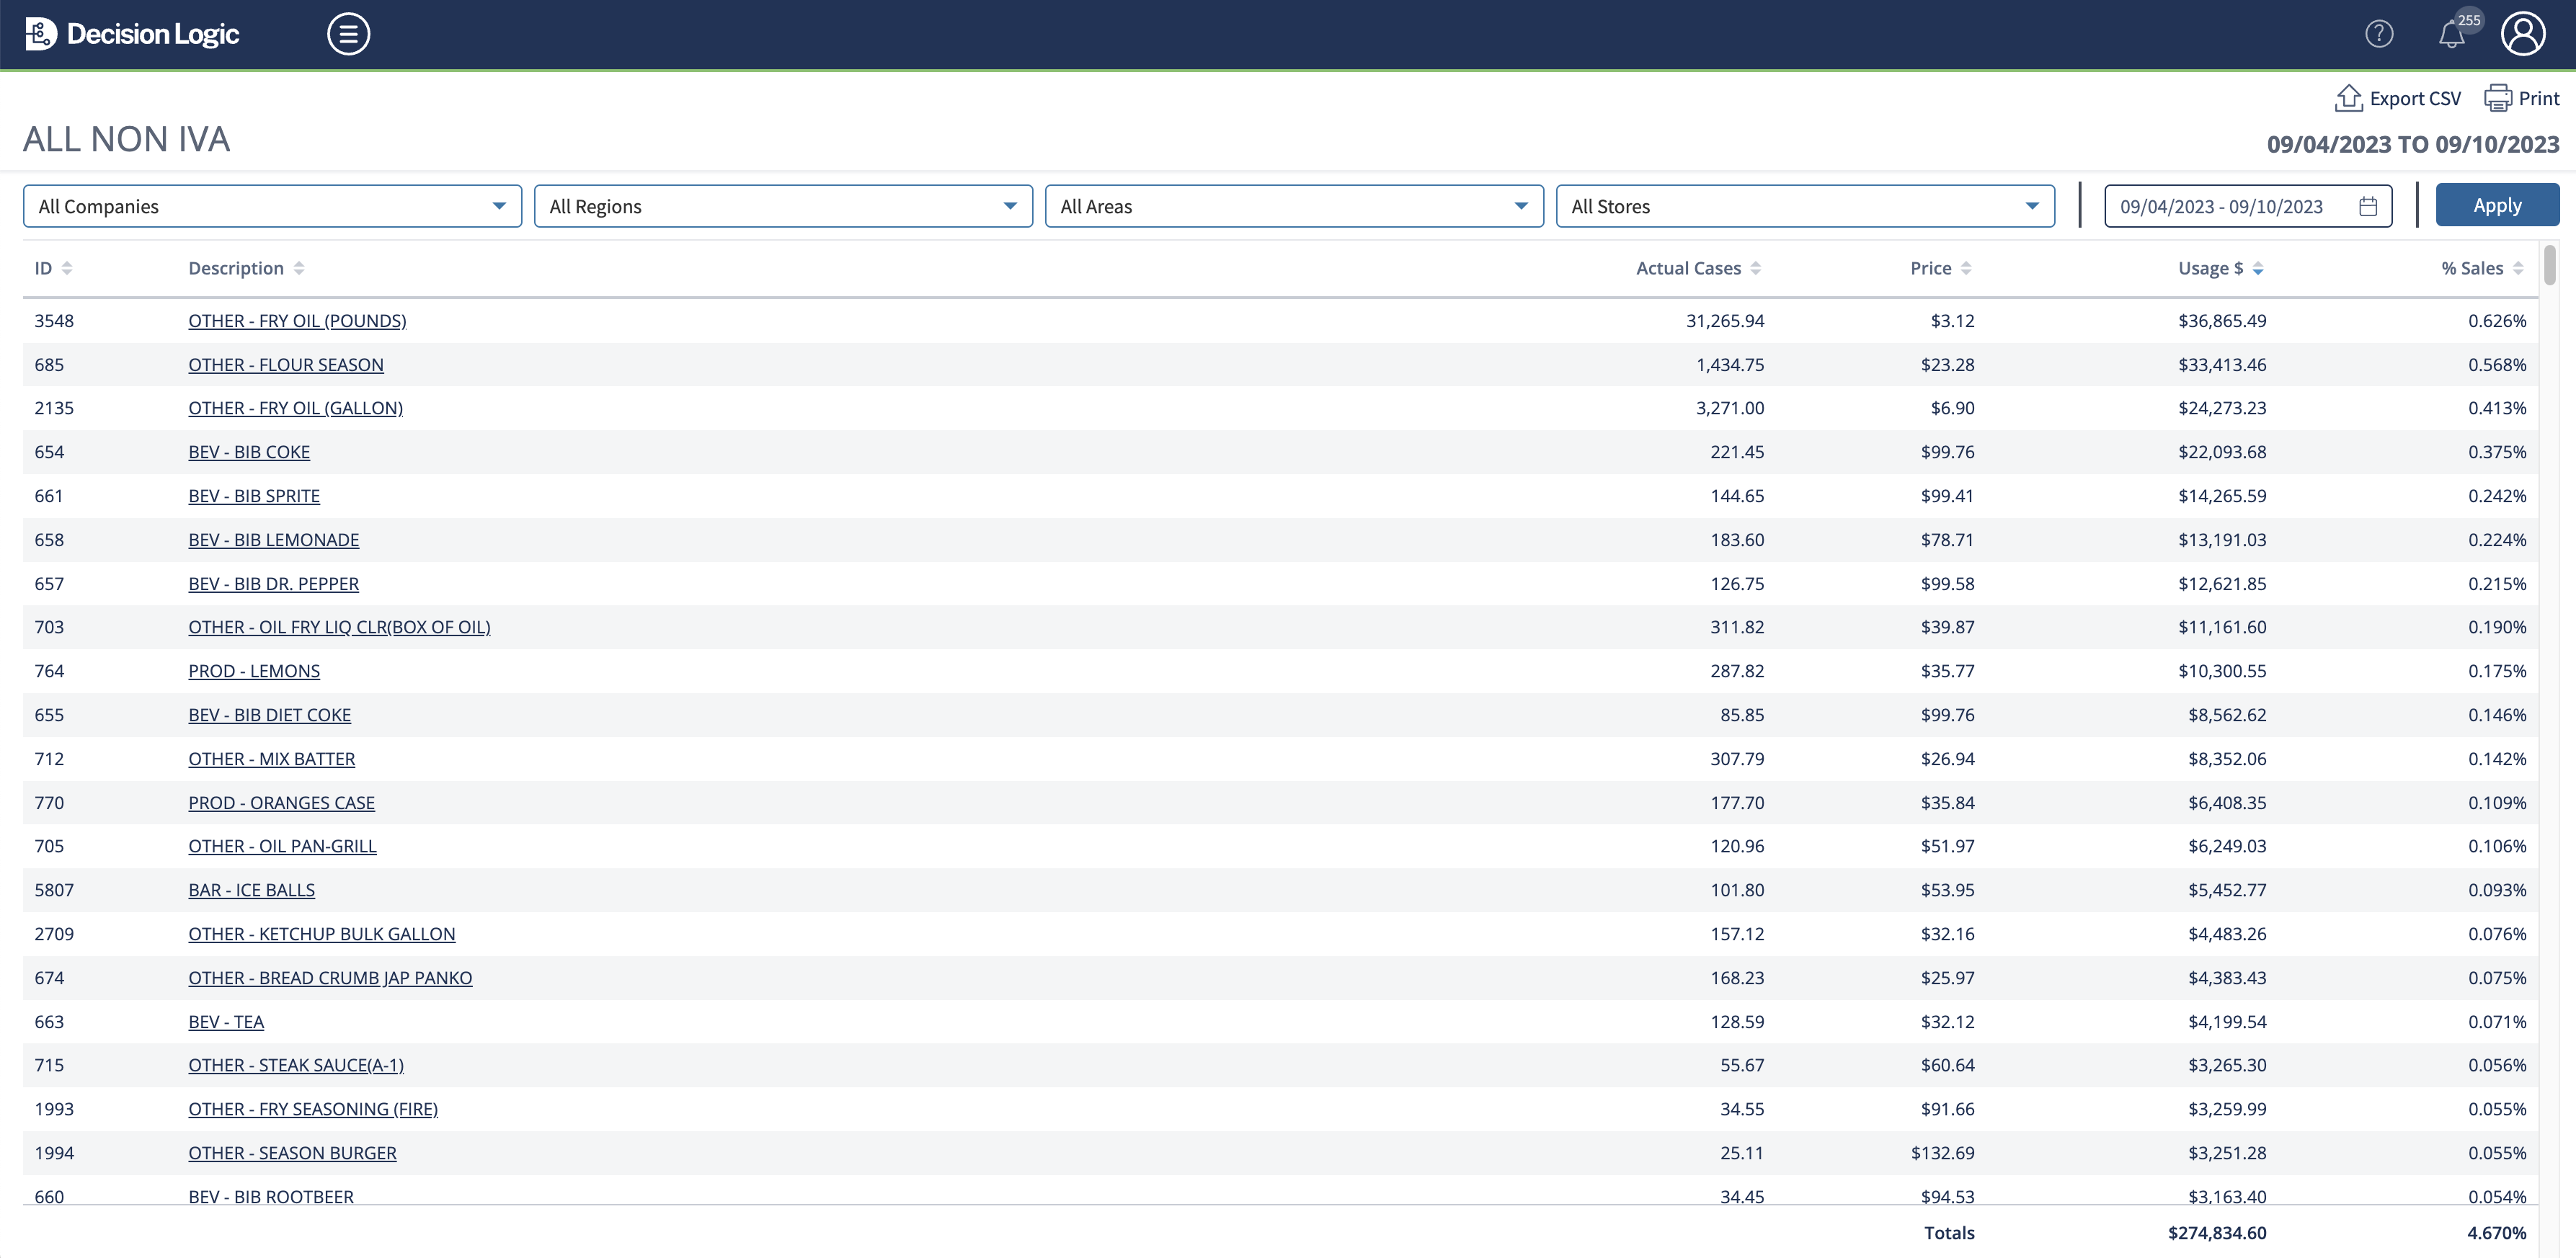
Non-IvA Usage
Non-IvA usage Usage allows a user to see the usage for products that are not selected for the IvA Report. Non-IvA items are typically items a kitchen manager cannot control a guest's usage, are not built into recipes, or are just a cost of business. i.e. Ketchup bottles, pop syrup, fryer oil
![]() Drill into specific food items to see the detail of the selected item
Drill into specific food items to see the detail of the selected item
![]() Note: Non-IvA is determined in Ingredient Management through the IvA checkbox
Note: Non-IvA is determined in Ingredient Management through the IvA checkbox
IvA Home can be found by navigating Navigate to Reports > Cost and Variance > IvA Home.

IvA Home displays a graphical representation of the trends of IvA, positive and negative items that most frequently have poor performance and true variance, positive variance, and negative variance for inventory history.
IvA Home can be searched by department, IvA type, store, and time range.
![]() Drill into inventory history dates to see high variance item detail of the selected inventory
Drill into inventory history dates to see high variance item detail of the selected inventory
The high variance view will display ingredient level detail for the selected inventory date range.
This includes:
Variance formula break down for each item (beginning inventory + Purchases - Ending Inventory = Actual - Ideal = Variance)
The Variance trend line for each item
Best handling practices for each item
Bid file and Prepped item mapping information
![]() Drill into a specific food item to see the detail of the selected item
Drill into a specific food item to see the detail of the selected item
Non-IVA Usage
Duplicate IvA Reporting on an Ingredient
If several different Recipe Multipliers (RMX) are set up for an ingredient and you run the IvA report for ALL stores, you will see the ingredient reporting as many times as there is an additional RMX set up on the bid files mapped to that ingredient.
This can usually be found in the Beverage IvA report, where stores order different pack sizes of liquor. If three stores order three different size bottles of house vodka, for example, and the report is run by ALL stores, then the house vodka ingredient will report three times. If you run the report by individual stores, it will only report once if that store only orders one pack size.
Likewise, if one location has orders in the same week for two different pack sizes, which are both mapped to the same ingredient, then that location will see double reporting on their IvA. We suggest ordering only one pack size within a week to avoid this when possible.
Ideal Usage is
not reporting.Not Reporting
You will want to ensure that there is a recipe set up that includes the Ingredient that is not reporting Ideal usage.
If you have recently created a new ingredient that is replacing an older ingredient, you will want to ensure that the recipes also get updated.
Once the Recipe has been updated, you will want to run a /wiki/spaces/DOC/pages/28835927 > to your IvA for any prior weeks you want the new recipe to report Ideal usage in.
| Info |
|---|
If the recipe was changed mid-week, you might see a slight variance for that week while you are transitioning to the new product. You will want to ensure that all of your locations are inventorying the new ingredient to meet the Shelf Extension requirement of two consecutive weeks of inventory for complete reporting. |
© 2023 2024 Knowledge Management Systems, LLC. Decision Logic. All Rights Reserved.
Table of Contents
| Table of Contents |
|---|
| Info |
|---|
For additional questions or assistance, please submit a support ticket by visiting the Decision Logic Service Center. |