Getting Started
When viewing TvA Store Summary reporting, users are able only to view one store at a time. This report does not provide a rollup for all locations.
Selecting a Store
Select the Company, Region, Area, and/or Store
Choose the Date Range
From date must be an Inventory date
To date must be the last date in the inventory week
⭐ This is the date before the next week’s Inventory Date
Select Apply
Users will need to select Apply each time switching dates and/or stores to display accurate information.


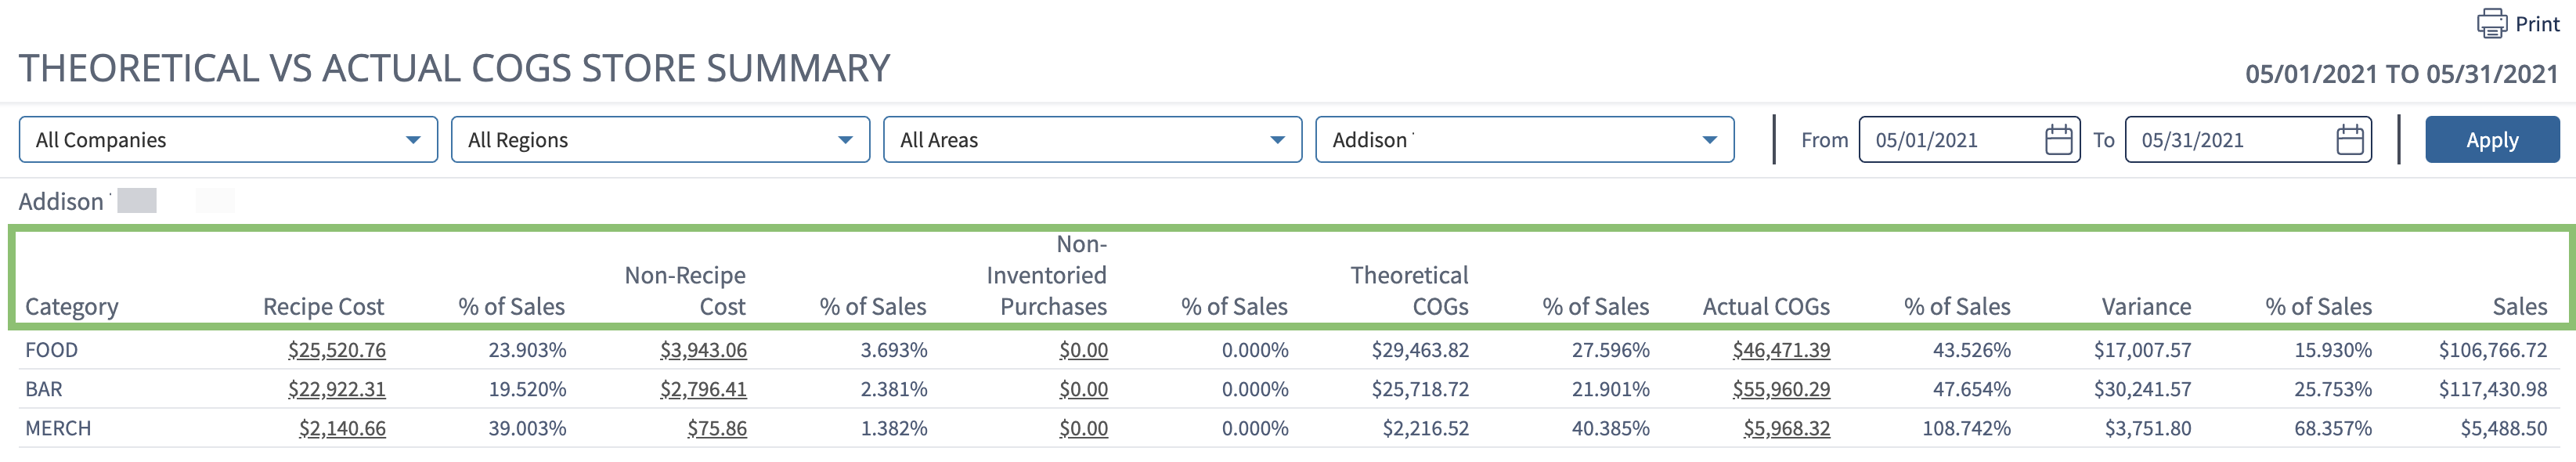
The store summary page will display a host of information. Below is an example of what you will see and the definitions and calculations for the columns in the table.
Definitions and Calculations
Metric/Column | Definition | Calculation |
|---|---|---|
Category | These are the parent COGS Category Sections which break down child COGS Categories that fall with into each Section. | COGS structure is configured in COGS Maintenance. |
Recipe Cost | Includes Usage of any Ingredient that is : used in the recipe of a Menu Item that is on a Menu Set that the store is assigned to, or flagged for IvA in Ingredient Management. | Menu Mix Recipe Unit Usage x $/Recipe Unit Example: Chicken = $0.50/OZ |
Non-Recipe Cost | Includes Usage of any Ingredient that : does not meet either of the two Recipe Cost conditions, and is flagged for IvA in Ingredient Management, regardless if an ingredient is in a recipe. | Since there is not Recipe Usage, Actual COGS Usage (BI + P - EI) is used. The reporting requires that it meets at least 1 of 3 conditions:
Since there is not Recipe Usage, Actual COGS Usage (BI + P - EI) is used.
|
Non-Inventoried Purchases | Includes any distributor item that: wasreceived on an order (purchase) that was assigned to a COGS Category, but not assigned to an Ingredient. | Since there is no ingredient to determine Recipe Usage or Inventoried values, the system uses the Purchased value as the (Non-Inventory Cost) Theoretical Usage. Example: |
Theoretical COGS | Total Theoretical Cost of Goods Sold per COGS Section or COGS Category | Recipe Cost + Non-Recipe Cost + Non-Inventory Cost = Theoretical Cost of Goods Sold |
Actual COGS | Beginning Inventory + Purchases - Ending Inventory = Actual COGS Includes child COGS Categories that fall under the parent COGS Category Section that have at least one Ingredient or Distributor Item with at least one of the following:
| Beginning Inventory + Purchases - Ending Inventory = Actual COGSSum of Recipe, Non-Recipe, and Non-inventory purchases
|
Variance | The difference between Actual and Theoretical Cost of Goods Sold | Actual COGS - Theoretical COGS = Variance |
Sales | Sales per COGS Section and Category are by assigned POS Admin Department. | Sales are allocated in COGS Maintenance. |
Store Summary Detail Views
Store Summary detail views display item details sorted by variance; largest positive (theoretical loss) to largest negative (theoretical growth).
Each view has the option to 🖨 Print the report.
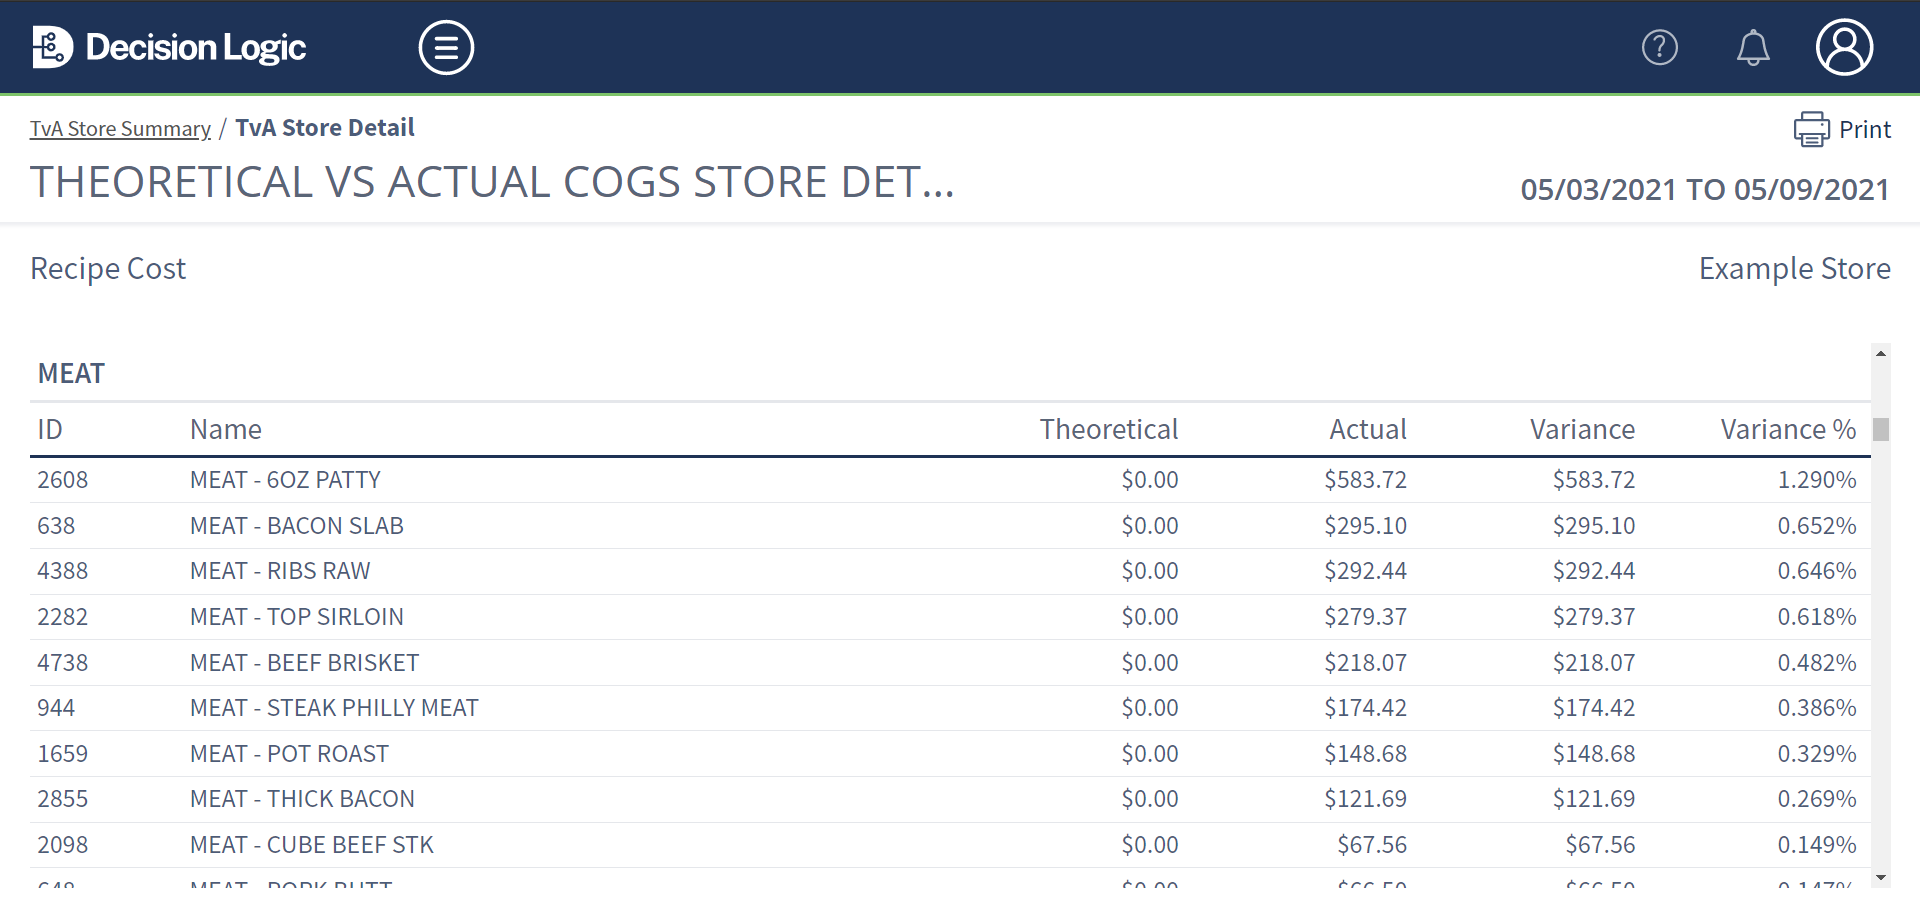
Recipe Cost
Selecting a COGS Section's Recipe Cost value displays each Ingredient’s Theoretical Cost, Actual Cost, Variance of the two in the dollar, and percent amount representative of the COGS Category’s Sales. The Ingredient’s COGS Category groups these.
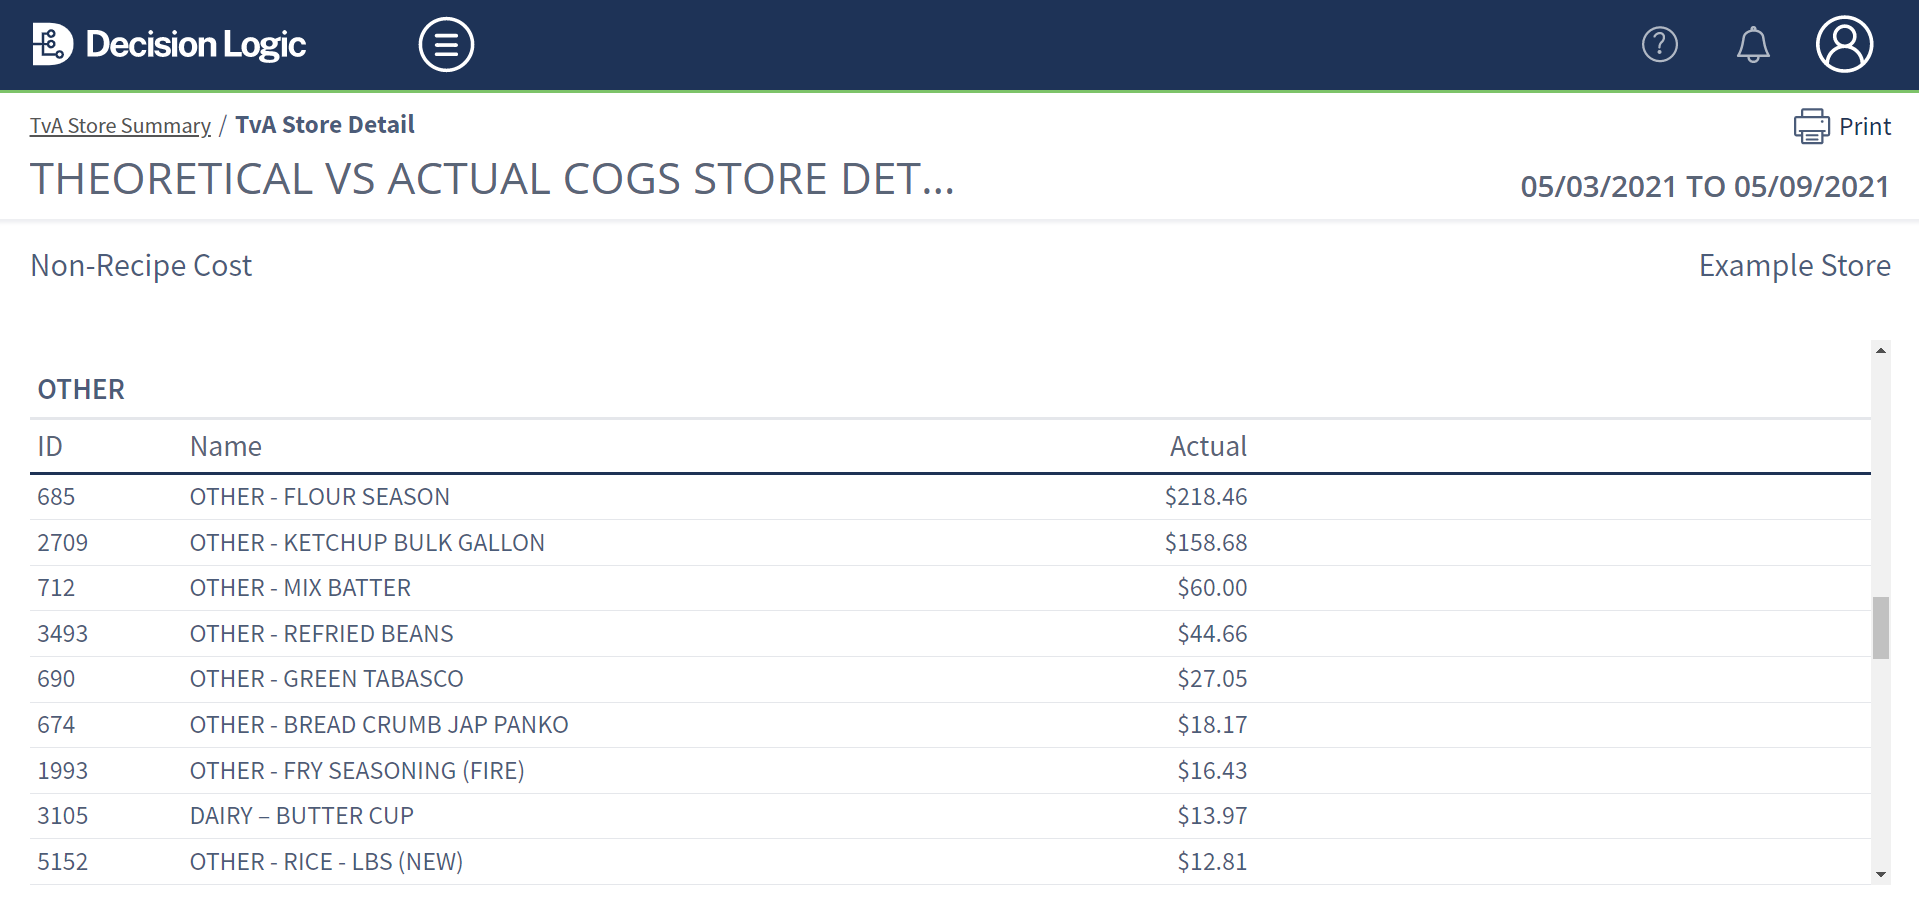
Non-Recipe Cost
Selecting a COGS Section's Non-Recipe Cost value displays each ingredient’s Actual Cost.
⭐ The cost for Non-Recipe Ingredients uses the Actual Cost. The Ingredient’s COGS Category groups these.
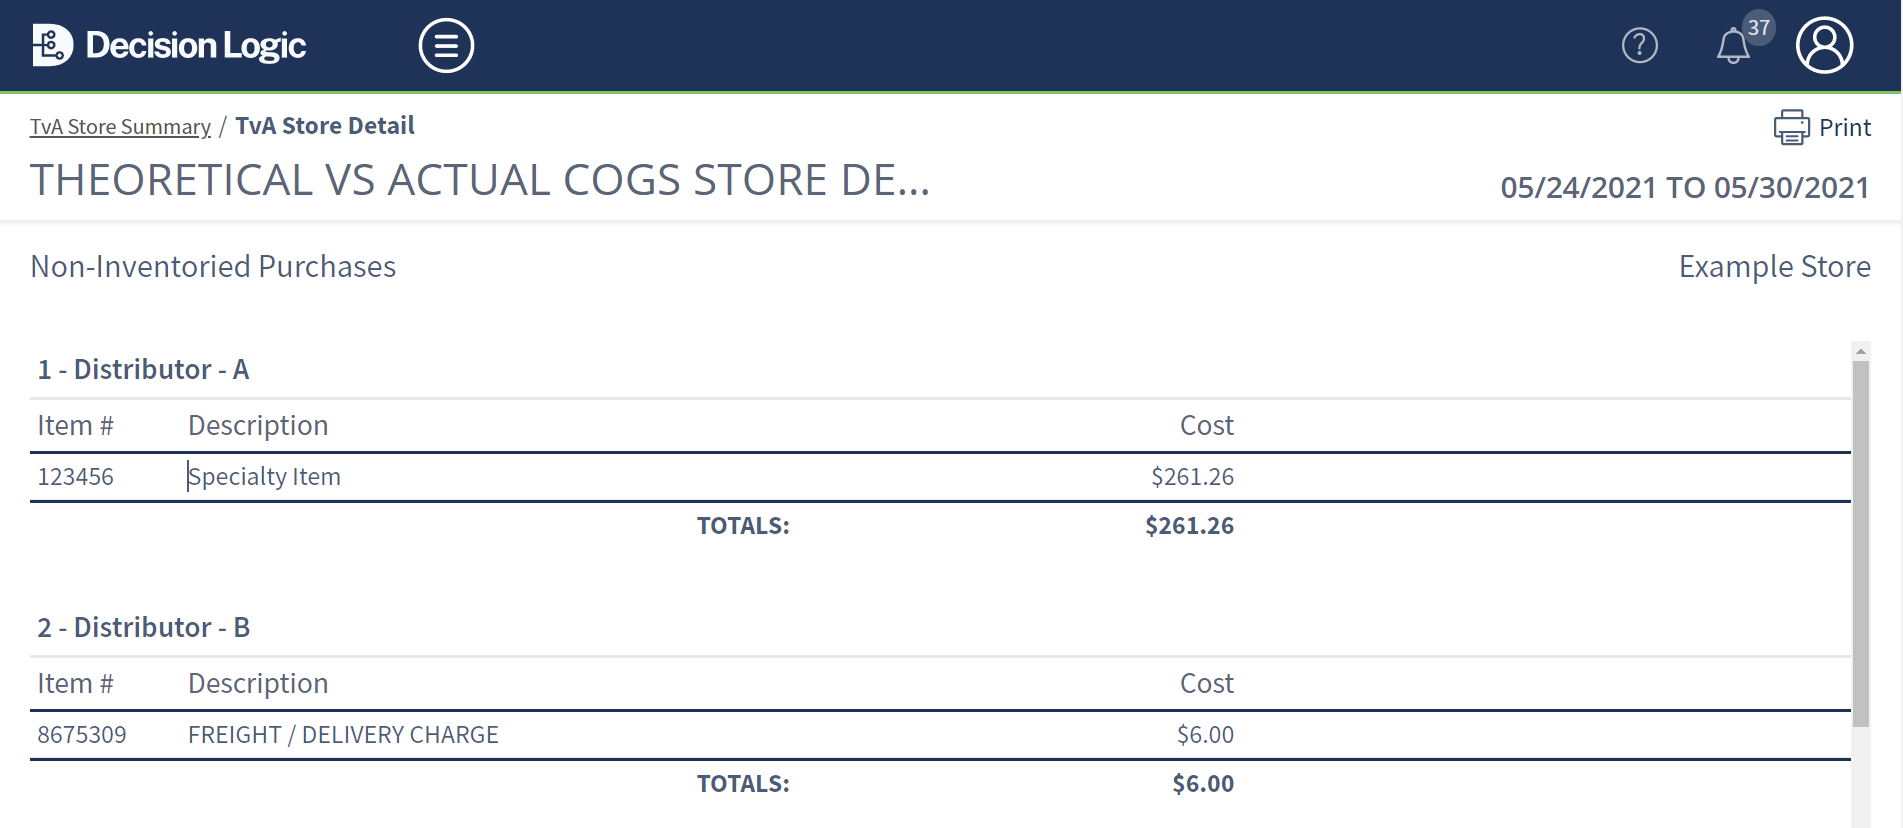
Non-Inventoried Purchases
Selecting a COGS Section's Non-Inventoried Purchases value displays each Distributor Item’s Actual Cost.
⭐ The theoretical cost for Non-Inventoried Purchases shows the Actual Cost (Purchase). The item’s Distributor groups these.
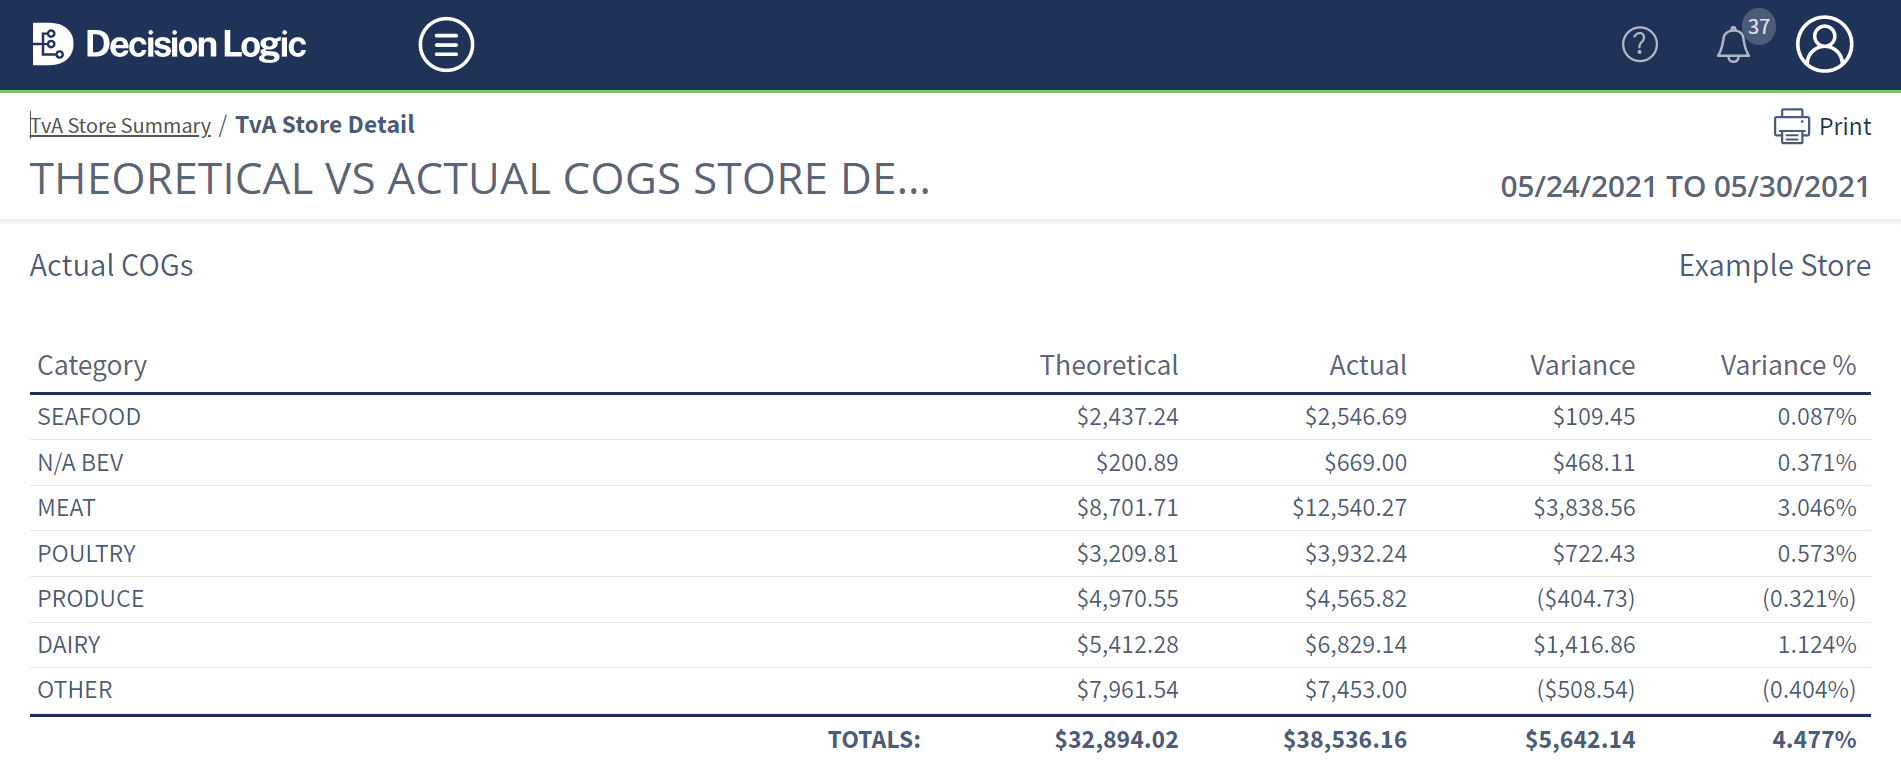
Actual COGS
Selecting a parent COGS Section's Recipe Cost value displays each child-COGS Category’s Theoretical Cost, Actual Cost, Variance of the two in the dollar, and percent amount representative of the COGS Category’s Sales.