View Negative Food IvA
Once logged into Decision Logic from a web browser, navigate to:
Reports > Cost and Variance > Negative Food IvA
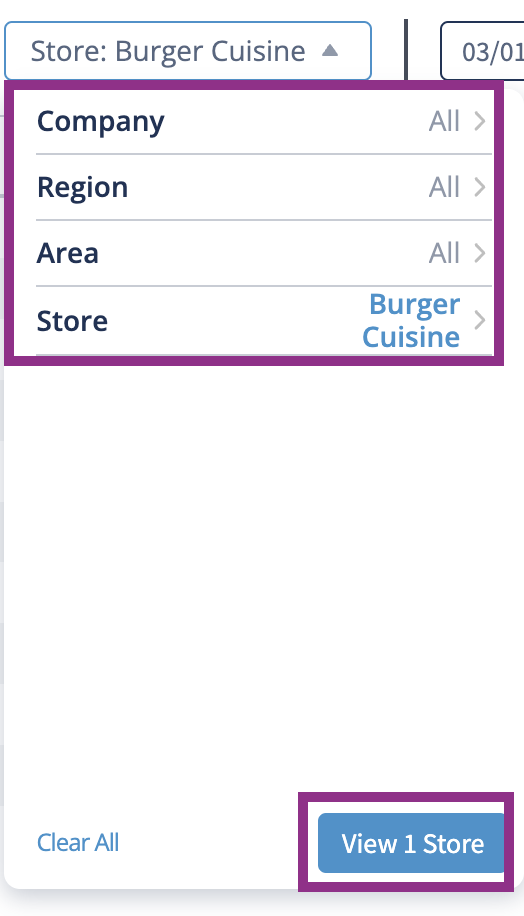
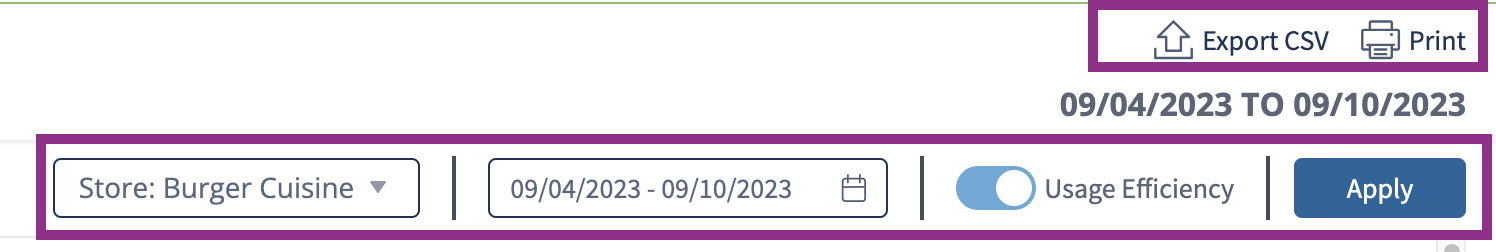
Select the Company, Region, Area, and or Store.
Click View X Store.
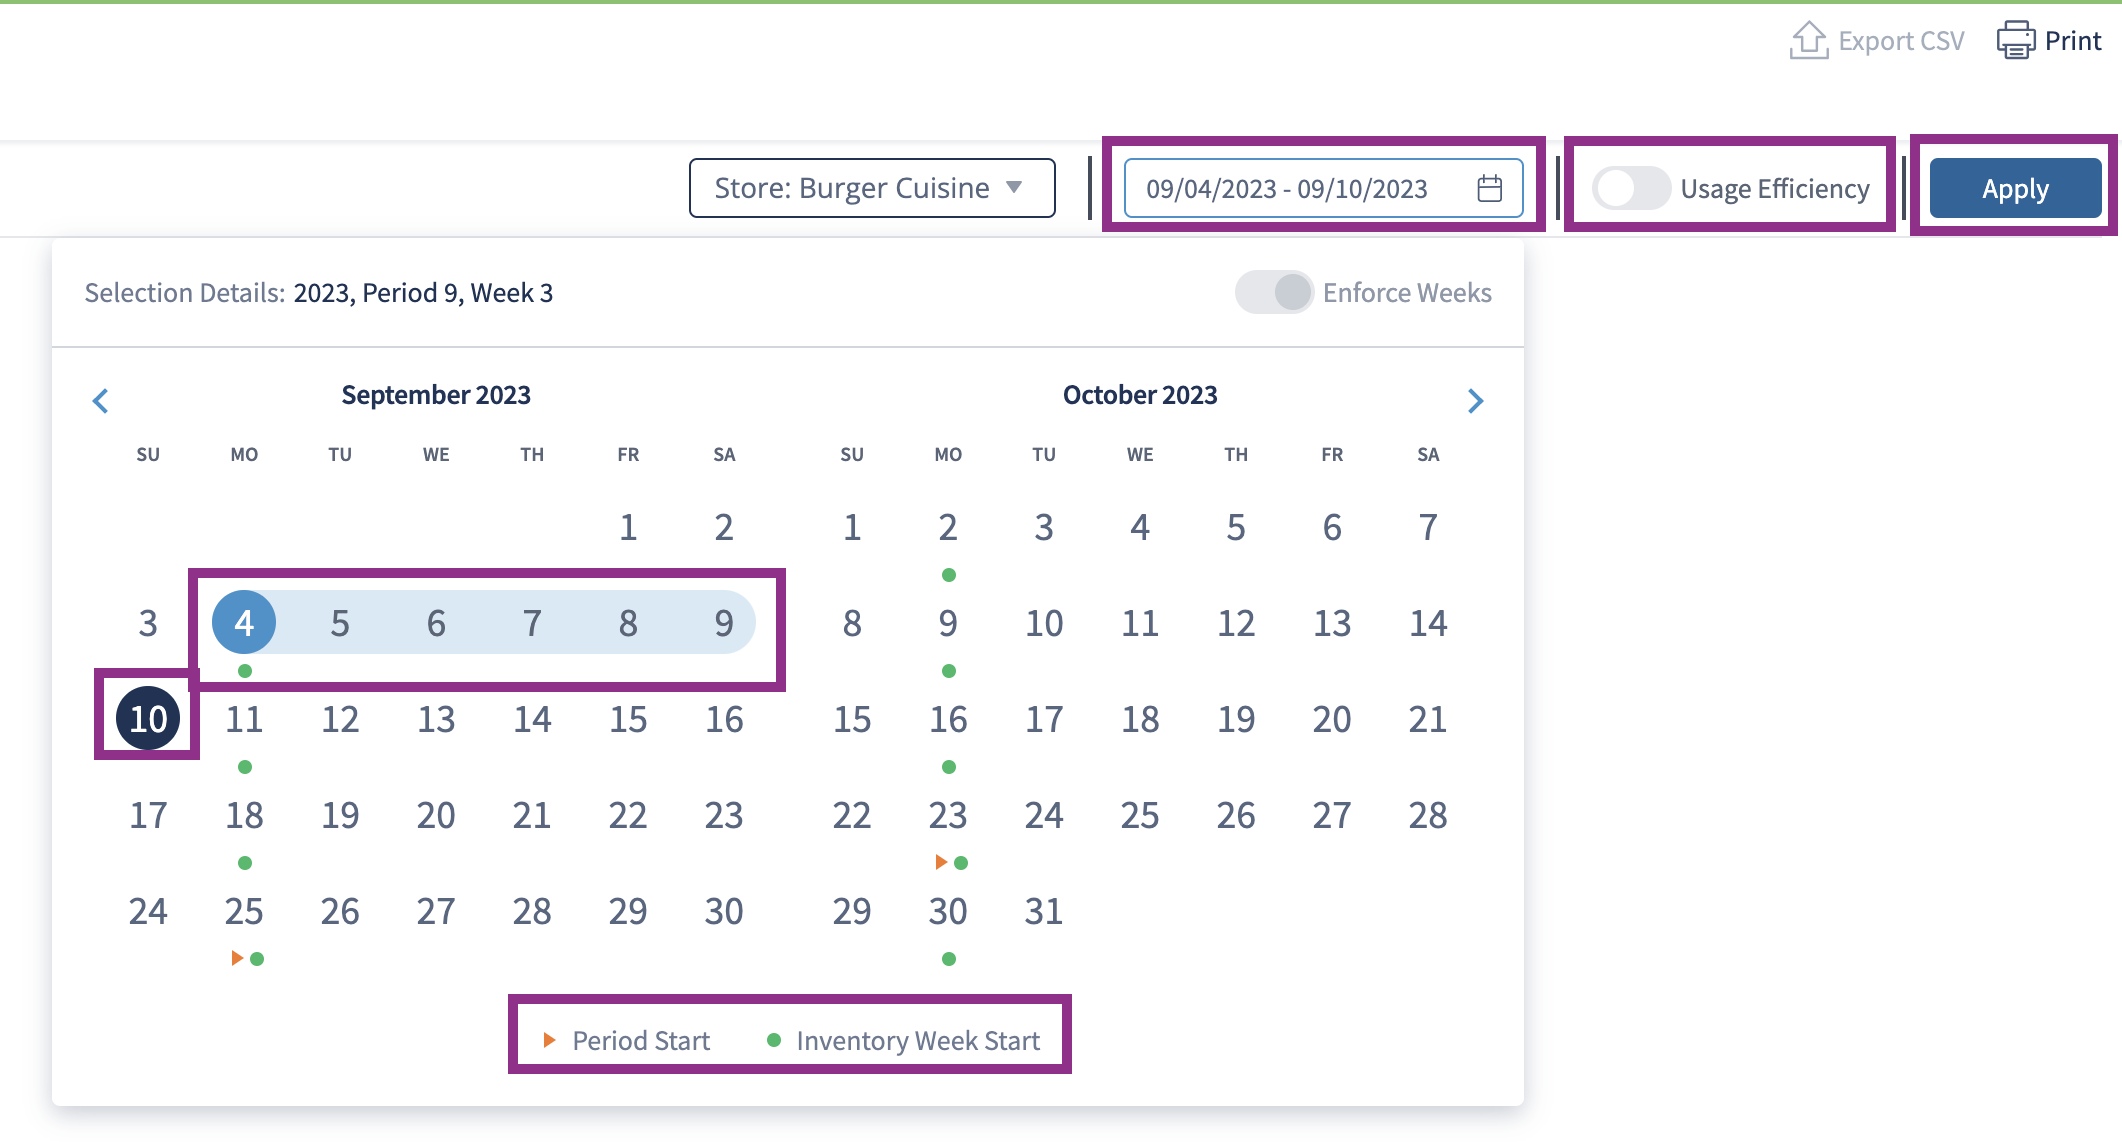
Select a Date Range.
The green dot under a date represent an inventory cycle and will default to the current week.
Period Start is the beginning of that store’s period.
Users can toggle Usage Efficiency if applicable.
Usage Efficiency: Shows the usage efficiency for the select store(s) and the company’s efficiency for each item
Click Apply.

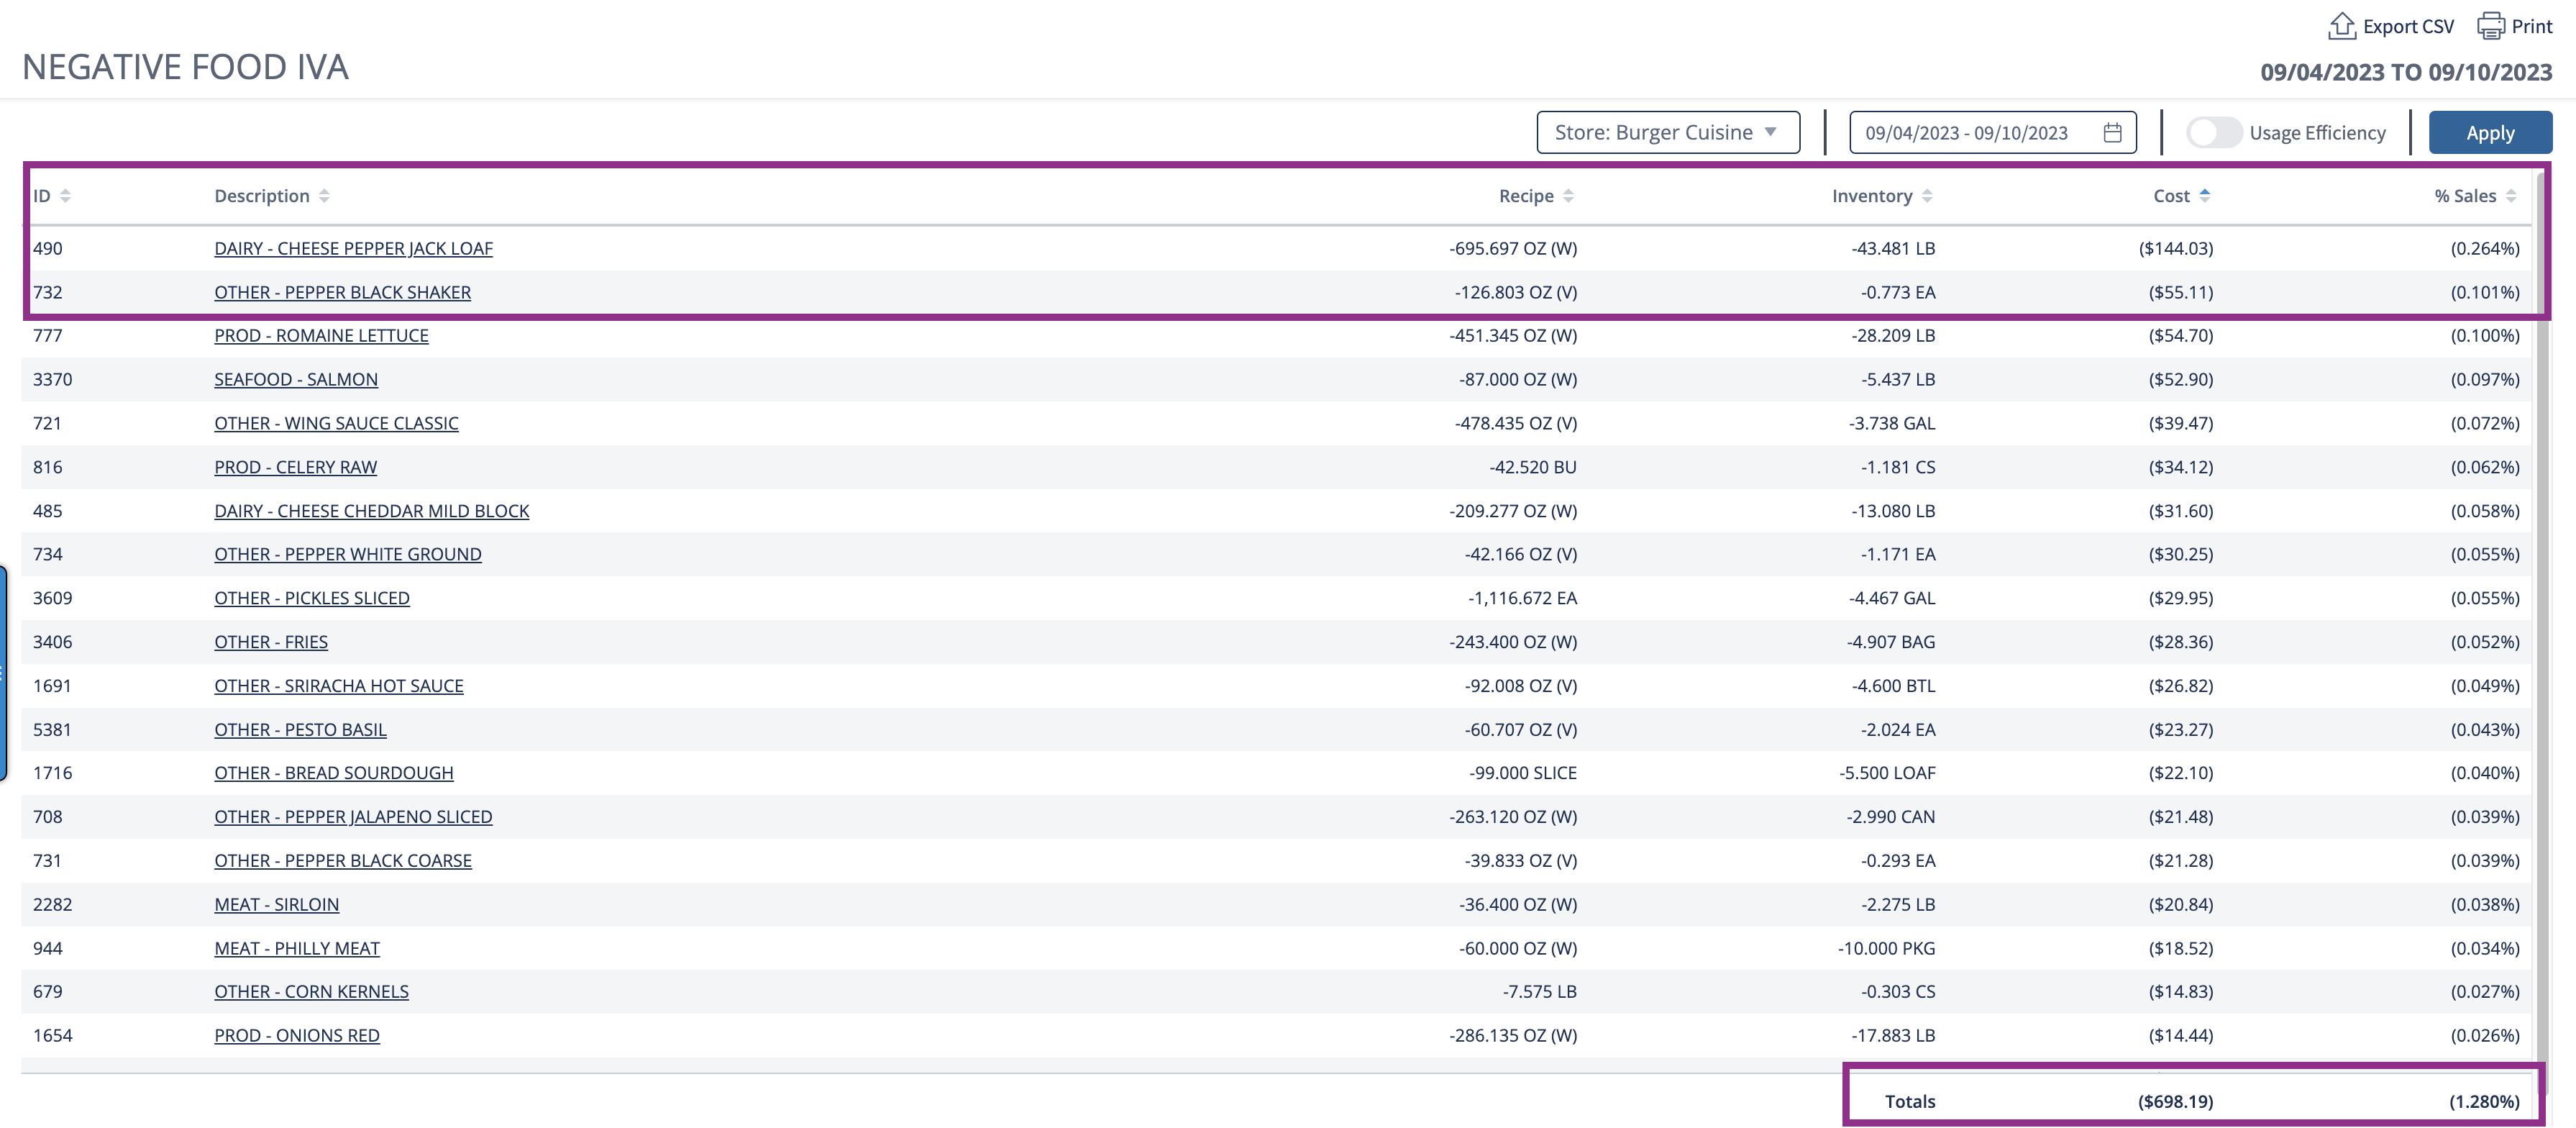
If users do not toggle usage Efficiency when running the report, the results will appear in order from the highest variance based on Cost. Additionally, users can click on an individual item to display the Product Details, which provides a more in-depth look at the calculations for the item.
The report displays the Recipe Variance, Inventory Variance, Cost Variance, and % of Sales affected.
The Cost is the market value of the negative variance.

Product Details

Usage Efficiency
Usage Efficiency is a visualization of the dollar variance as a percentage of Ideal Usage. In addition, the report shows a bar graph for Store(s) Efficiency and a vertical line for Company Efficiency. These metrics are a comparison between the store selected and other stores.
Clicking on an individual item will pull up the Product Details page, which provides a more in-depth look at the calculations for the item. Check out the image above.

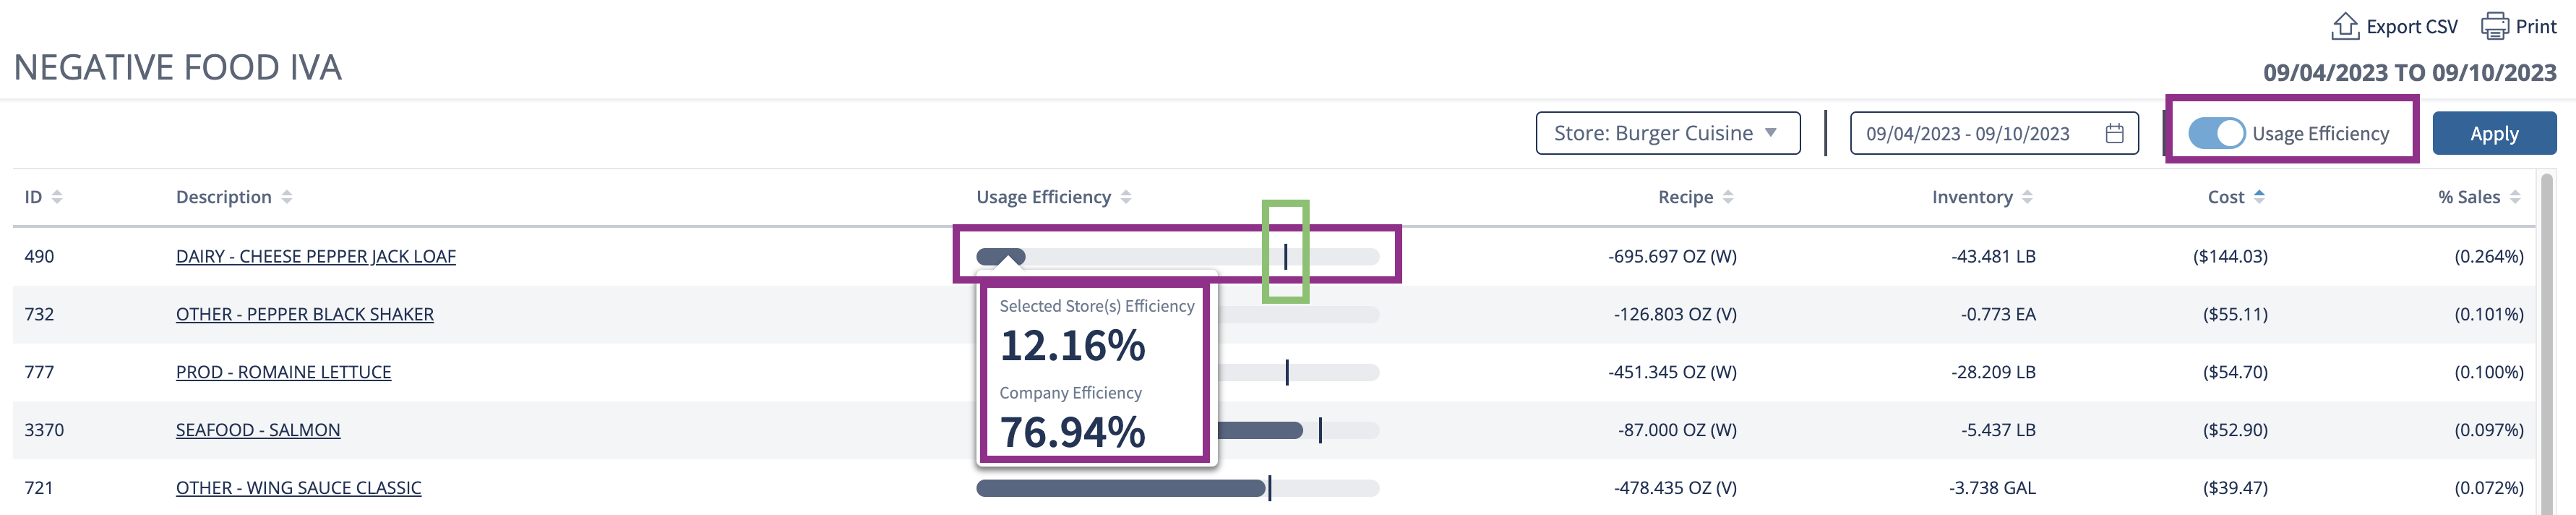
The goal is to strive for 100% usage efficiency for Store(s) and Company Efficiency.
Calculations
Metric Name | Calculation |
Recipe Total | Recipe Units x Units Sold |
Recipe Mx | Conversion between Ingredient’s Inventory Measure and its Recipe Measure. Example: 1 Case = 4 Each. 1 Each = 6 LBs. |
Ideal Usage | Recipe Total / Recipe Mx; sum of all inventory unit totals |
Actual Usage | Beginning Inventory + Orders Received - Ending Inventory Orders Received includes credits and Inter Unit Transfers (IUT) |
Variance | Actual Usage - Ideal Usage |
Usage Efficiency | 1 - (Recipe Variance / Ideal Usage) |
Print or Export Report
After logging into the web-based application, navigate to:
Reports > Cost and Variance > Top 20 Food IvA
Select the Company, Region, Area, and or Store.
Click View X Store.
Select a Date Range.
The dots under a date represent an inventory cycle and will default to the current week.
Users can toggle Usage Efficiency if applicable.
Usage Efficiency: This shows the select store(s) usage efficiency and the company’s efficiency for each item.
Click Apply.
Click Export CSV or Print.

| Info |
|---|
Check out these helpful links. |
What and where is the Beverage IvA report?
What and where is the All Food IvA report?
What and where is the Top 20 Food IvA report?
What and where is the Non-IvA Usage report?
What and where is the Cost and Variance report, and how do I customize or export it?
What and where is the Payroll Report?
What and where is the TvA Store Summary report?
What and where is the Cost of Goods Sold (COGS) report?
© 2024 Knowledge Management Systems, LLC. Decision Logic. All Rights Reserved.